 MICHAEL
 · Link analysis
The network is already in your records. Nobody typed it in.
Every phone number, vehicle, address and co-defendant in a case file is a link waiting to be drawn. Social network analysis, which most analysts call link analysis, draws them from the table you already have. No graph database to stand up, no second system to populate, and nobody spending a week in a diagramming tool.
You choose what counts as a connection.
Tick the columns that mean something in your data: suspect name, phone, vehicle, address, gang affiliation, a field your agency invented. Records sharing a value get connected, and each field draws in its own color, so you can see at a glance whether a cluster is held together by phones or by addresses.
- 01A shared address is not a shared phone. Two people at the same apartment block is weak. Two people on the same handset is not. Because each field draws separately, you can switch one off and watch what survives. A cluster that disappears when you drop addresses was never a network. It was a building.
- 02Rarity can set the weight. A value two records share is more interesting than one five hundred records share. Weighting links by rarity draws the unusual connection thick and the common one thin, so the eye lands on the link that means something rather than the one that happens most often.
- 03Multi-value cells get split, if you say so. Records systems jam three phone numbers into one field separated by semicolons. MICHAEL can read each one as its own value rather than treating the whole string as a single key, which is the difference between finding the link and missing it entirely.
- 04It says what it could not use. A link model that silently drops the rows it could not parse is worse than no link model, because you will brief the picture either way. Records that could not be joined are counted and reported.
A graph you can defend, not just display.
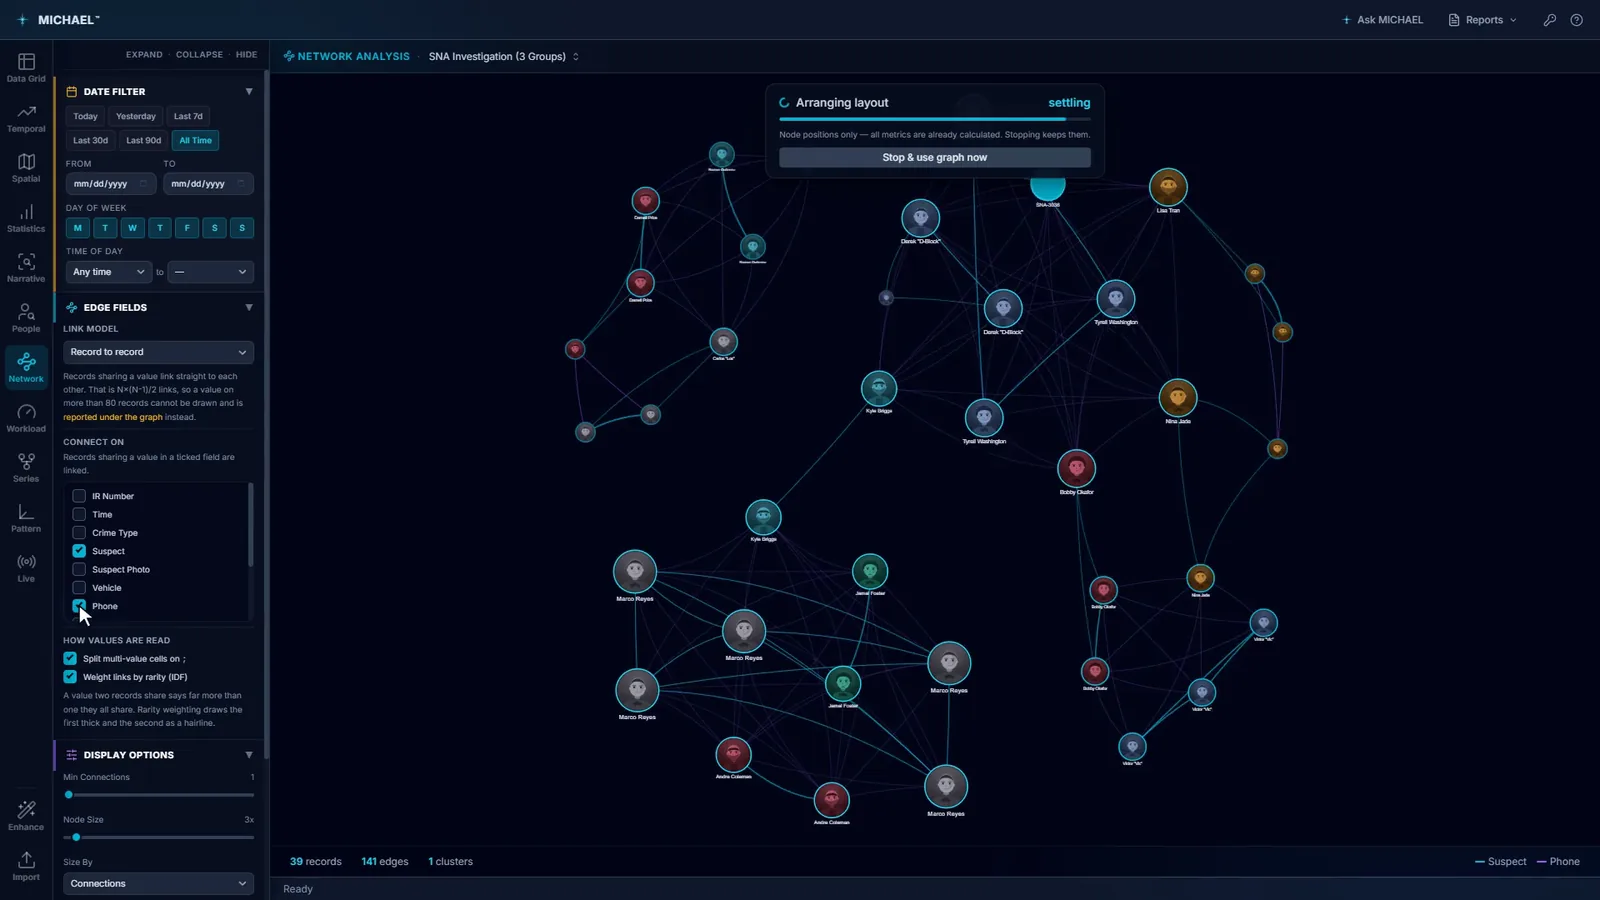
Thirty eight records, one hundred and forty one edges, eight clusters. Synthetic sample data, at the size a real case file actually arrives in.
"Most connected" is the least useful thing you can know.
Every centrality measure answers a different operational question, and picking the wrong one puts the wrong person at the center of your briefing. MICHAEL computes six, and names what each one is for.
- DEGDegree. Direct connections. The obvious one, and the one that most often points at a taxi driver or a shared landline rather than anyone of interest.
- RCHReach. Unique nodes within two hops. How much of the network a person can touch without an introduction.
- EFFReach efficiency. Reach divided by connections. This surfaces the efficient connector, the person who touches a lot of the network through very few relationships, rather than the loud one who knows everybody.
- BTWBetweenness. The bridges. Whose removal splits the network into pieces that can no longer reach each other. For a disruption decision this is usually the measure that matters, and it is almost never the person with the most connections.
- CLOCloseness. Who reaches everyone else fastest. Useful when the question is how quickly something moves rather than who controls it.
- EIGEigenvector. Who is connected to the well connected. A person with four relationships can outrank a person with forty, if those four are the right four.
Find the groups, then get everything else out of the way.
A graph with four hundred nodes is a picture of nothing. Two things make it readable.
- 01Community detection by label propagation. MICHAEL groups the network into clusters from the structure itself, with nobody deciding in advance how many groups there should be. Each cluster takes its own color, so a crew that shares nothing with the rest of the file becomes visible as a crew.
- 02Focus mode. Select a node and isolate everything within one to five hops of it. The rest goes away. This is the view that belongs in a briefing, because it answers one question instead of showing every question at once.
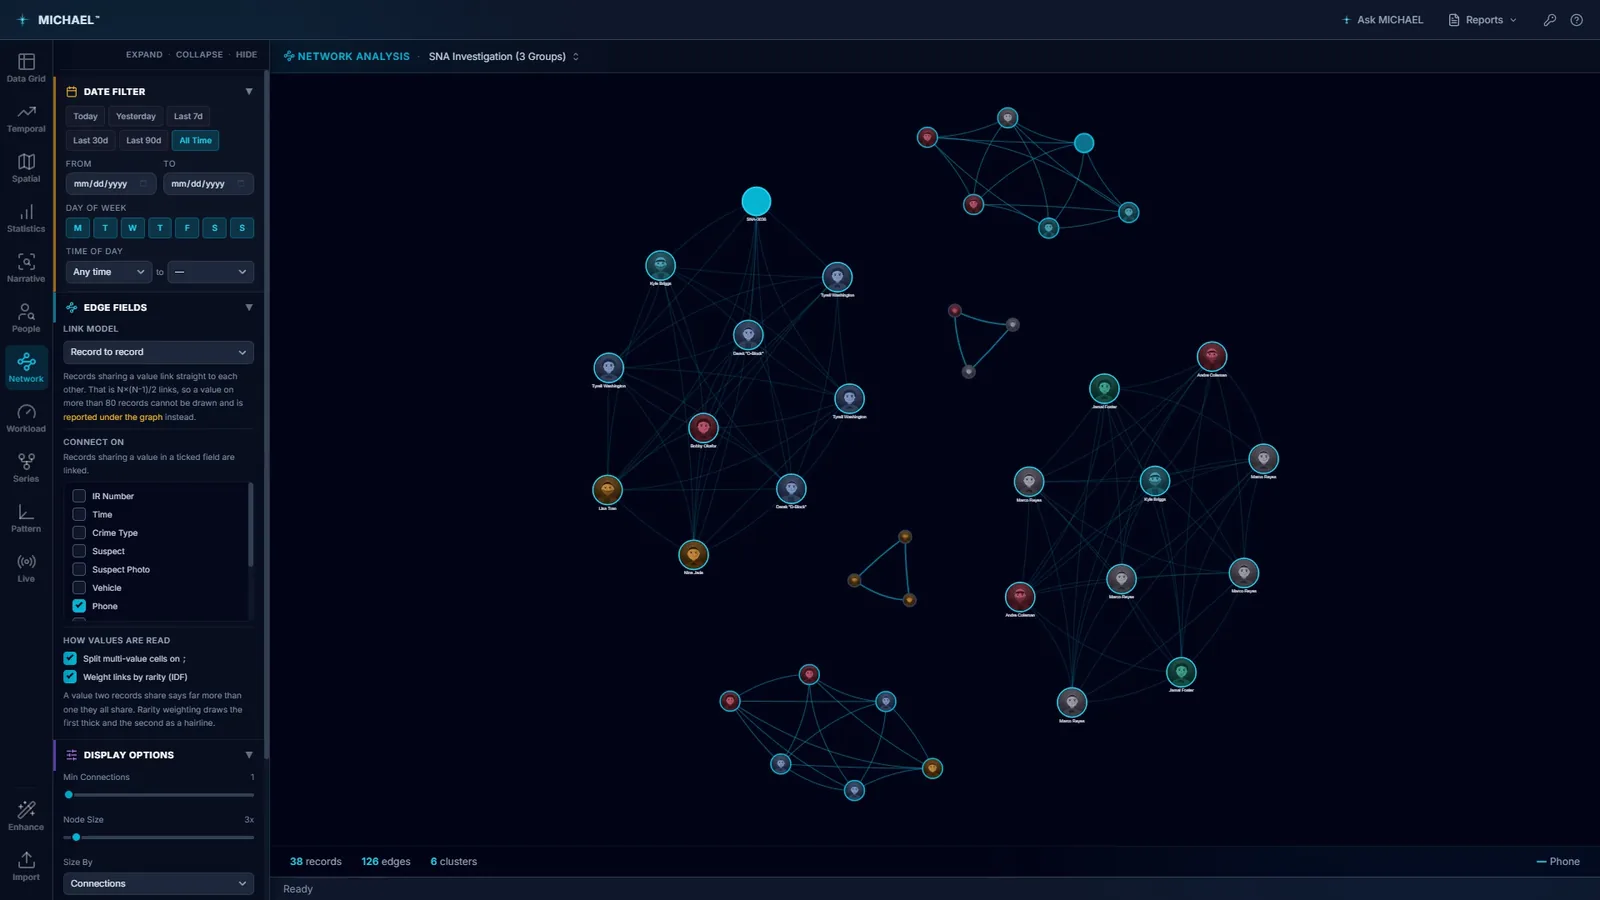
The same records, grouped by structure rather than by anything anyone typed in. Synthetic sample data.
It will not tell you who the boss is.
Centrality is a property of your data, not of the organization. A person is central in this graph because of what got written down about them, which is a different thing from being central in real life.
- 01Reporting bias is in the picture. The person your agency has stopped forty times will look well connected whether or not they are. The graph shows your records honestly, and your records are a record of what officers wrote down.
- 02A missing link looks exactly like no link. Two people who only ever met in person leave no edge. Nothing in the picture marks that absence, so the absence stays yours to remember.
- 03No score becomes a person. MICHAEL ranks nodes within your data and stops there. It does not produce a threat score, a risk tier, or a list of people to go and look at.
Run it on your own case file.
Fourteen days, every feature, on one machine. Nothing to activate. Your data stays on your machine and stays yours when the trial ends.
Or email info@sworn.ai, or call (801) 410-0123. A person answers both.