 MICHAEL
 · Crime series detection
Point it at a year of data. It tells you which crimes are one series.
Crime series detection and crime pattern analysis without a schema to map or a threshold to guess. MICHAEL compares every pair of records in your data, weights each field by how rare the shared value actually is, and prints what an ordinary pair scores in your dataset so a finding has something real to clear.
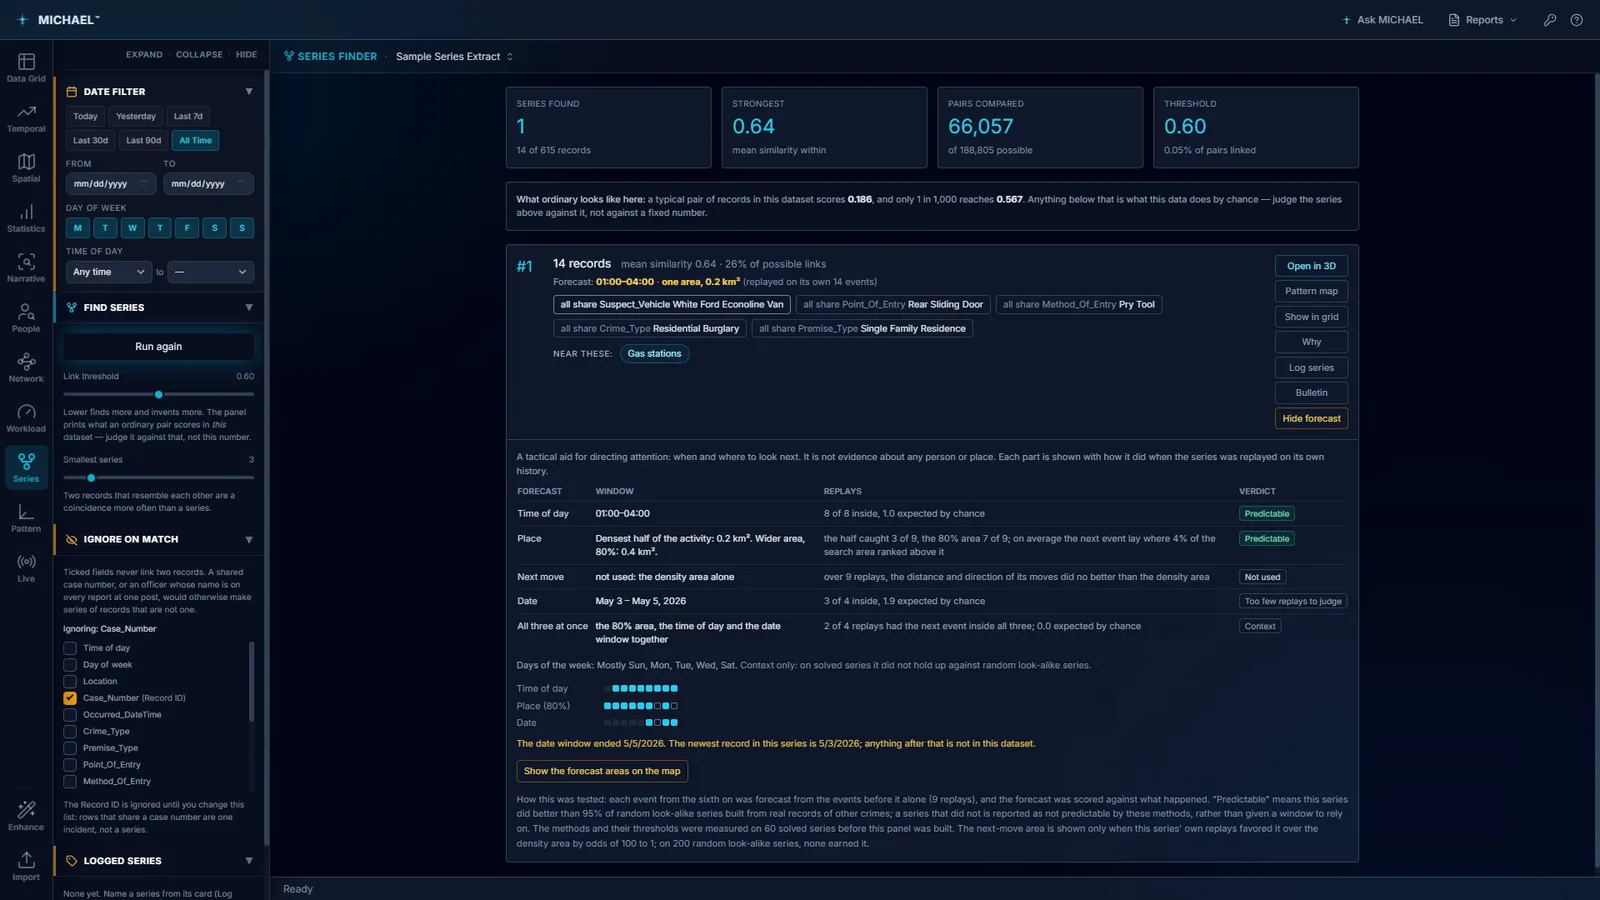
One series, 14 records out of 615, from 66,057 pairs compared. The panel states what a typical pair scores in this data (0.186) before it states what the series scored (0.64). Sample series extract.
Every dataset has a tightest cluster. That is not the same as a series.
Point any linking tool at any pile of records and it will hand you back the most similar group it can find, with a confident-looking score attached. The group always exists. Whether it means anything is a different question, and most tools never ask it.
- 01It prints what ordinary looks like here, first. On the sample extract: a typical pair scores 0.186, and only 1 in 1,000 pairs reaches 0.567. The series scored 0.64. Those three numbers together are an argument. The 0.64 on its own is decoration.
- 02Judge the series against your data, not against a fixed number. A threshold that means "strong" in one agency's burglary data means "coincidence" in another's. The panel says so in those words, right above the slider, because the number that matters is the one your records produce.
- 03It is allowed to have no opinion. Pairs with too little in common score nothing at all rather than zero. "Not enough overlap to judge" and "these are unalike" are different answers, and only one of them is honest.
- 04Deterministic. Two runs of the same query return the same series in the same order. That matters the moment the output goes into a report somebody signs.
Rarity does the weighting, so you do not have to.
Two burglaries sharing "Residential" tells you almost nothing, because nearly everything is residential. Two sharing a white Ford Econoline van tells you a great deal. MICHAEL works out which is which from your own data rather than from a rulebook somebody wrote about a different city.
- 01Every field is weighted by how rare the shared value is. Measured in the dataset you loaded, so the weighting moves with your records instead of being tuned once and left.
- 02It works on the columns you already have. Categorical, numeric, date and coordinate fields are all weighted the same way. No schema to map, no required fields, no import template to fill in before you can ask a question.
- 03Every link is explainable. A series opens with the fields its members actually agree on and the share that agree. Continuous fields report the real spread rather than a label. Press Why on any series and it tells you, record by record.
- 04Ignore On Match, for the fields that lie. A shared case number, or an officer whose name is on every report at one post, would otherwise make a series out of records that are one incident. Tick those fields and they never link two records. Record ID is ignored by default, for exactly that reason.
Each part of the forecast is scored on the series' own history.
A forecast nobody tested is a guess with a map behind it. MICHAEL replays the series against itself: every event from the sixth onward is forecast from the events before it alone, and the forecast is scored against what actually happened.
- 01Time of day, place, next move and date, each judged separately. On the sample series the time window caught 8 of 8 replays and the 80% area caught 7 of 9, both marked Predictable. They are not averaged into one confidence number, because a series can be reliable about the hour and useless about the date.
- 02A part that did not earn its place says so. The next-move area on that series reads Not used: the density area alone, because over nine replays the distance and direction of its moves did no better than plain density. The date window reads Too few replays to judge. Those verdicts are the feature, not a shortfall.
- 03"Predictable" has a definition. It means the series did better than 95% of random look-alike series built from real records of other crimes. A series that does not clear that is reported as not predictable by these methods, rather than handed a window to rely on.
- 04The methods were measured before the panel existed. On 60 solved series. The next-move area is shown only where that series' own replays favored it over the density area by odds of 100 to 1; across 200 random look-alike series, none earned it.
- 05It states where its own data stops. On the sample the date window ends 5/5/2026 and the newest record in the series is 5/3/2026, and the panel says plainly that anything after that is not in this dataset. A forecast that runs past the edge of the data is the easiest way to brief a hole as a finding.
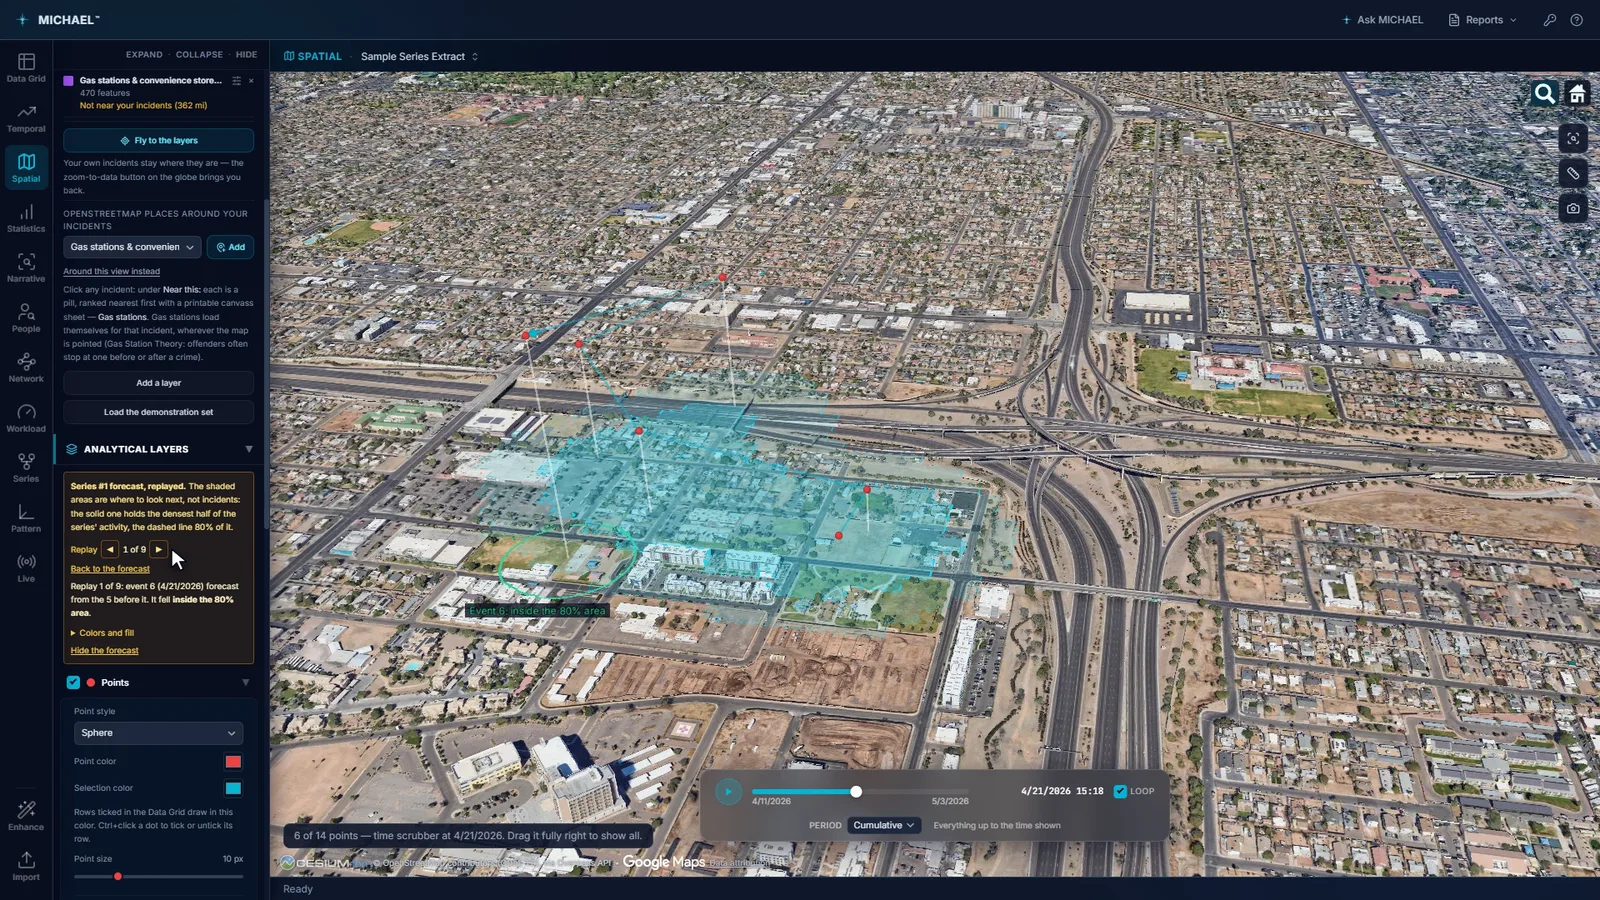
The solid area holds the densest half of the series' activity; the dashed line is the 80% area. The panel is explicit that the shaded areas are where to look next, not incidents. Sample series extract on public imagery.
Every case placed by how alike it is to every other case.
Series Finder answers "which of these are one series". The Pattern Map answers the broader question behind it: what is the shape of this whole dataset, and which cases sit near which. Four layouts, each a different way of asking.
- MDSMultidimensional scaling. Every case placed by similarity to every other, and the map prints how faithful the picture is. A two-dimensional drawing of a many-dimensional thing always loses something; this one tells you how much.
- RMDSRadius-MDS, which shows the second-order links. The same placement with rings. Click a case and everything the engine links to it takes a bright ring, everything linked to those a fainter one. Where rings gather, you are looking at links two and three steps out that no pairwise score would have shown you.
- CONConstellation and Axes. Constellation for the overall shape, Axes for placing cases against two fields you choose.
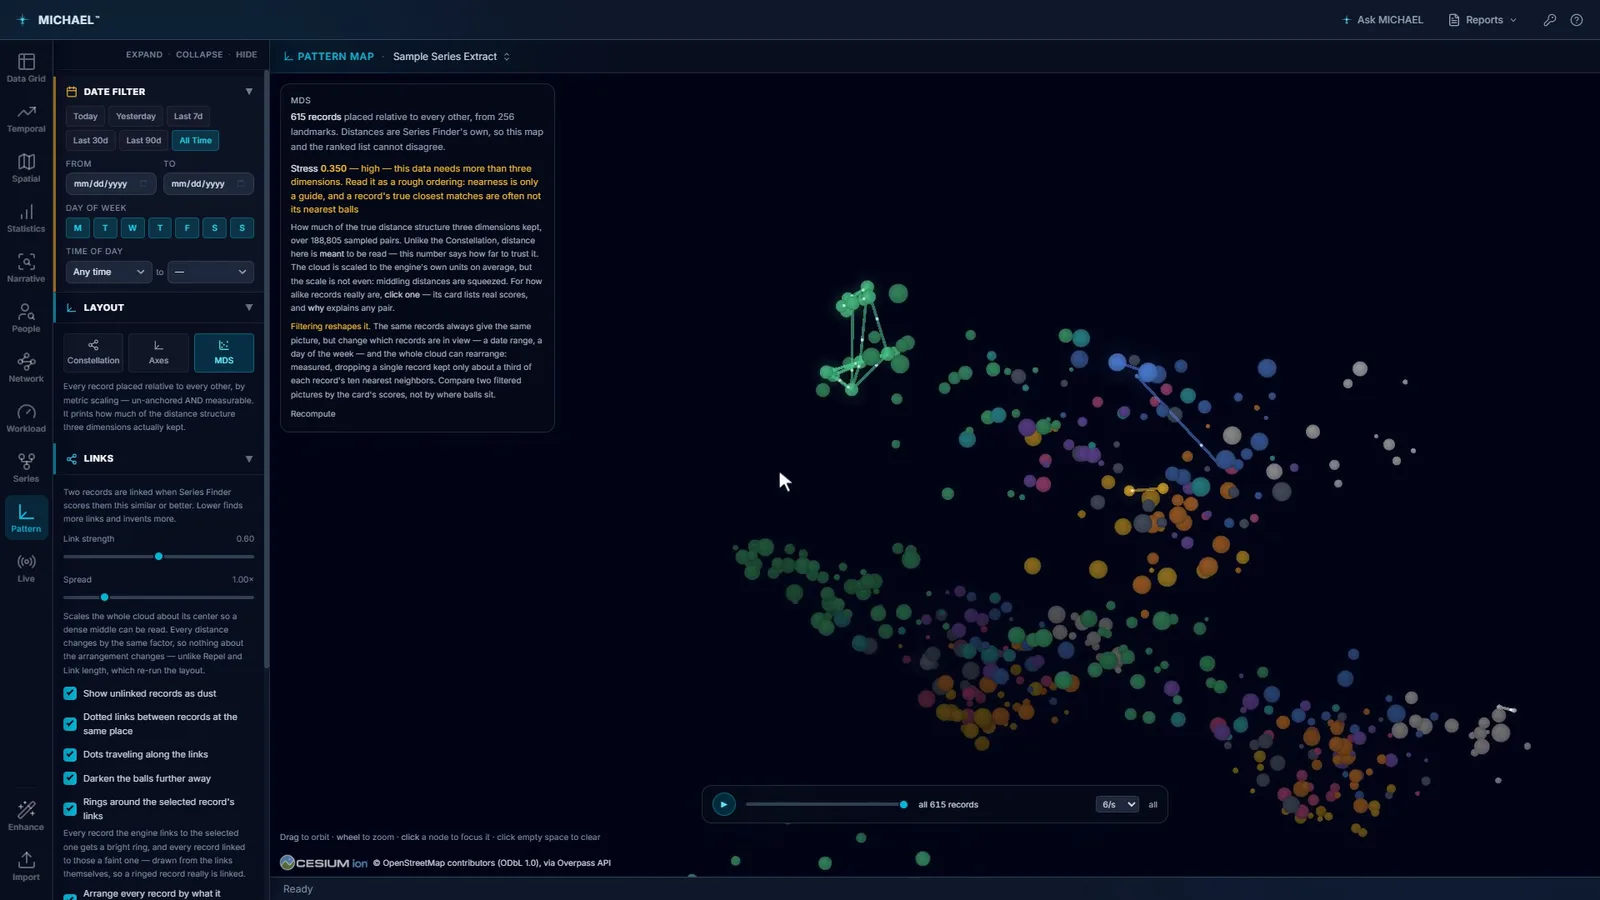
Cases placed by similarity rather than by location or time. Sample data.
It finds series in records. It does not find offenders.
Series Finder is a tactical aid for directing attention: when and where to look next. The panel says that in those words before it says anything else, and it is worth repeating here.
- 01It is not evidence about any person or place. A series is a statement about similarity between reports. It is a reason to look, and a reason to ask for more, and nothing beyond that.
- 02It can only see what was written down. A series linked on method of entry depends on somebody having recorded the method of entry. Where your agency codes thinly, the links thin out with it, and the tool cannot tell the difference between a pattern that is not there and a pattern nobody typed.
- 03No score becomes a person. MICHAEL ranks and links records within your data and stops. It produces no threat score, no risk rating and no watch list.
Try it on your own data.
Fourteen days, every feature, on one machine. Tell us who you are and we will email you your own download link. Nothing to activate. Your data stays on your machine and stays yours when the trial ends. No newsletter, no drip sequence.
Built for the people who do the work Sworn agencies, crime analysis units, public safety partners, and corporate investigation teams. Workstations are $2,500 a year, everything included. Academia and nonprofits: ask about license pricing.
Or email info@sworn.ai. A person answers.