 MICHAEL
 · Hot spot analysis
A heat map always shows a hot spot. That is the problem with heat maps.
Blur any scatter of points and you get a red blob somewhere. Crime hot spot mapping that stops there cannot tell you whether the blob means anything. MICHAEL does hot spot analysis with Getis-Ord Gi* and kernel density, and only draws the cells that pass a statistical test, which is why a random scatter usually shows none at all.
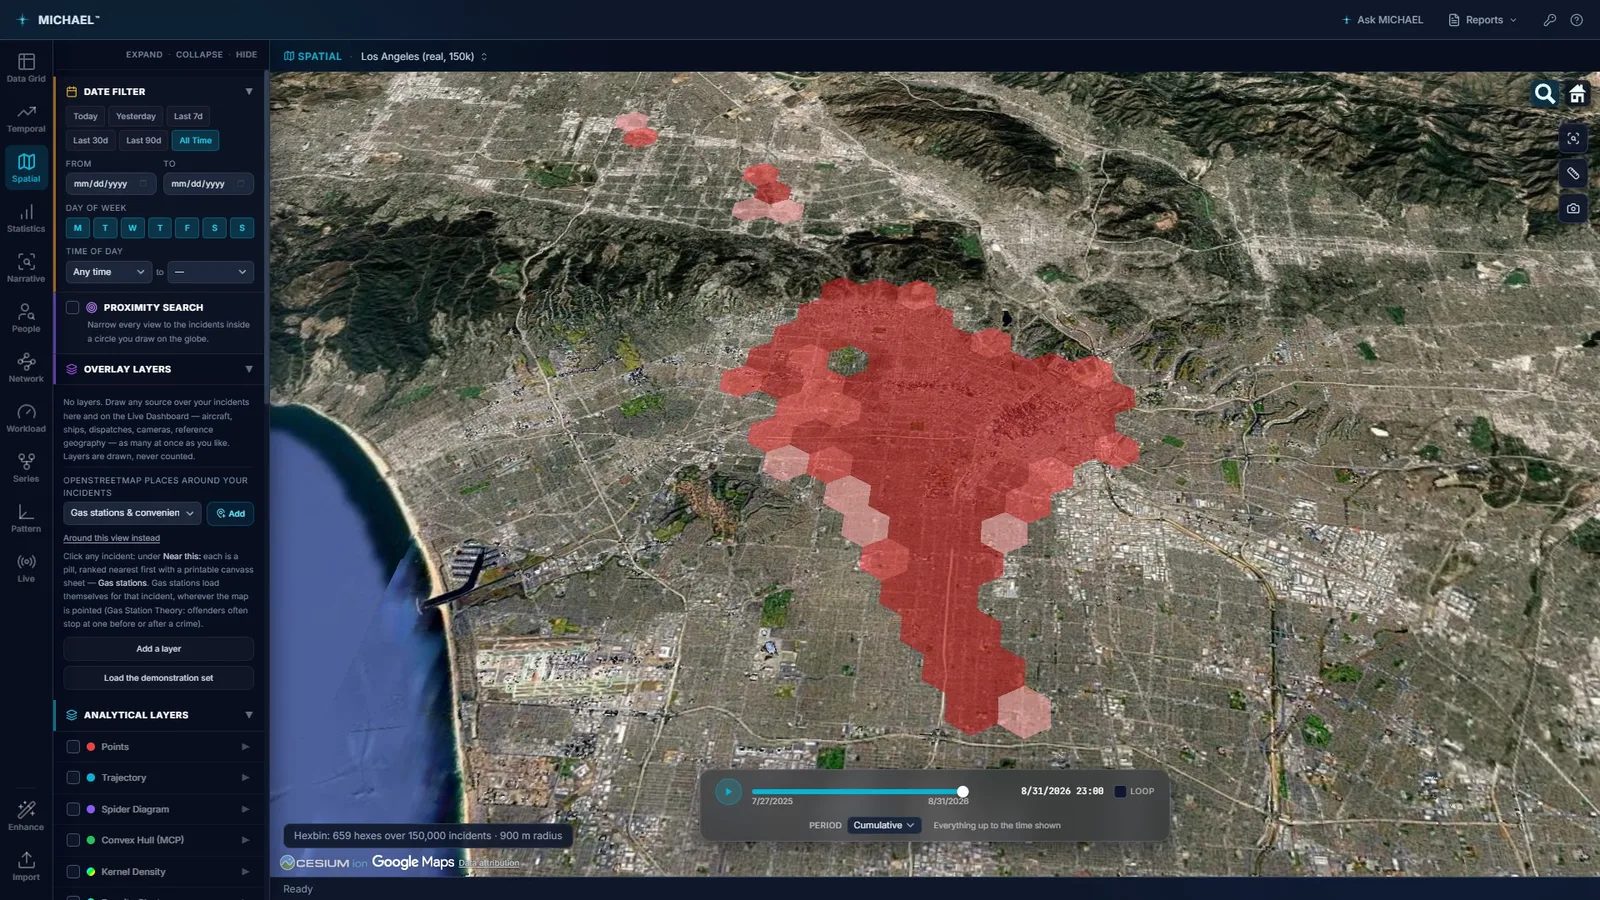
659 hexagonal cells over 150,000 incidents at a 900 metre radius. Public Los Angeles open crime data on public imagery.
The red area is where the points are. It is not a finding.
A density surface is a drawing of your data, and a drawing always comes out. Scatter a thousand points at random across a city, blur them, and the brightest part of that blur looks exactly like a hot spot. It has the same color, the same shape and the same authority in a briefing. It just does not mean anything.
- 01Density describes. It does not test. A kernel density surface answers "where are the points densest", which is a real and useful question. It does not answer "is this more than chance would give me", and most crime hot spot mapping never separates the two.
- 02Population and reporting are baked in. The densest part of a crime map is usually the densest part of the city, or the part your agency patrols hardest. Without a test against the surrounding area, a hot spot map of almost any offense is partly a map of where people are and partly a map of where officers go.
- 03The color ramp does the arguing. Change the radius or the classification and the blob moves. If the analysis has no significance test, there is nothing in the output to stop that, and nothing to tell the room which version to believe.
Getis-Ord Gi*, including the cells with nothing in them.
Gi* asks a different question: is this cell, taken together with its neighbors, unusual against the whole area. It is a test, so it can come back negative, and that is what makes a positive worth briefing.
- 01Every hexagon is tested, empty ones included. Leaving out the empty cells is the quiet way to guarantee a hot spot: it removes the evidence that most of the city is quiet. MICHAEL tests them all.
- 02Each cell is judged with its neighbors, against the whole area. A single busy block surrounded by quiet ones is a different thing from a busy block in a busy district, and Gi* is built to tell them apart. It reports cold spots on the same terms, which is often the finding nobody looked for.
- 03A false discovery rate correction, because you ran hundreds of tests. Test 659 hexagons at the usual thresholds and you should expect a handful to look significant by luck alone. Without a correction those strays get drawn, and somebody briefs one. With it, they do not.
- 04A random scatter usually shows none. That is the sentence worth sitting with. Give this analysis data with no structure in it and it draws nothing, where a heat map would have handed you a confident red area. A tool that can return nothing is a tool whose findings mean something.
- 05It follows the Hexbin radius, and reruns on demand. With its own radius left at zero it runs on the Hexbin layer's hexagons, so changing that radius runs the test again on the new cells rather than leaving a stale answer on screen. Run again on the records shown reruns it against whatever is currently in view.
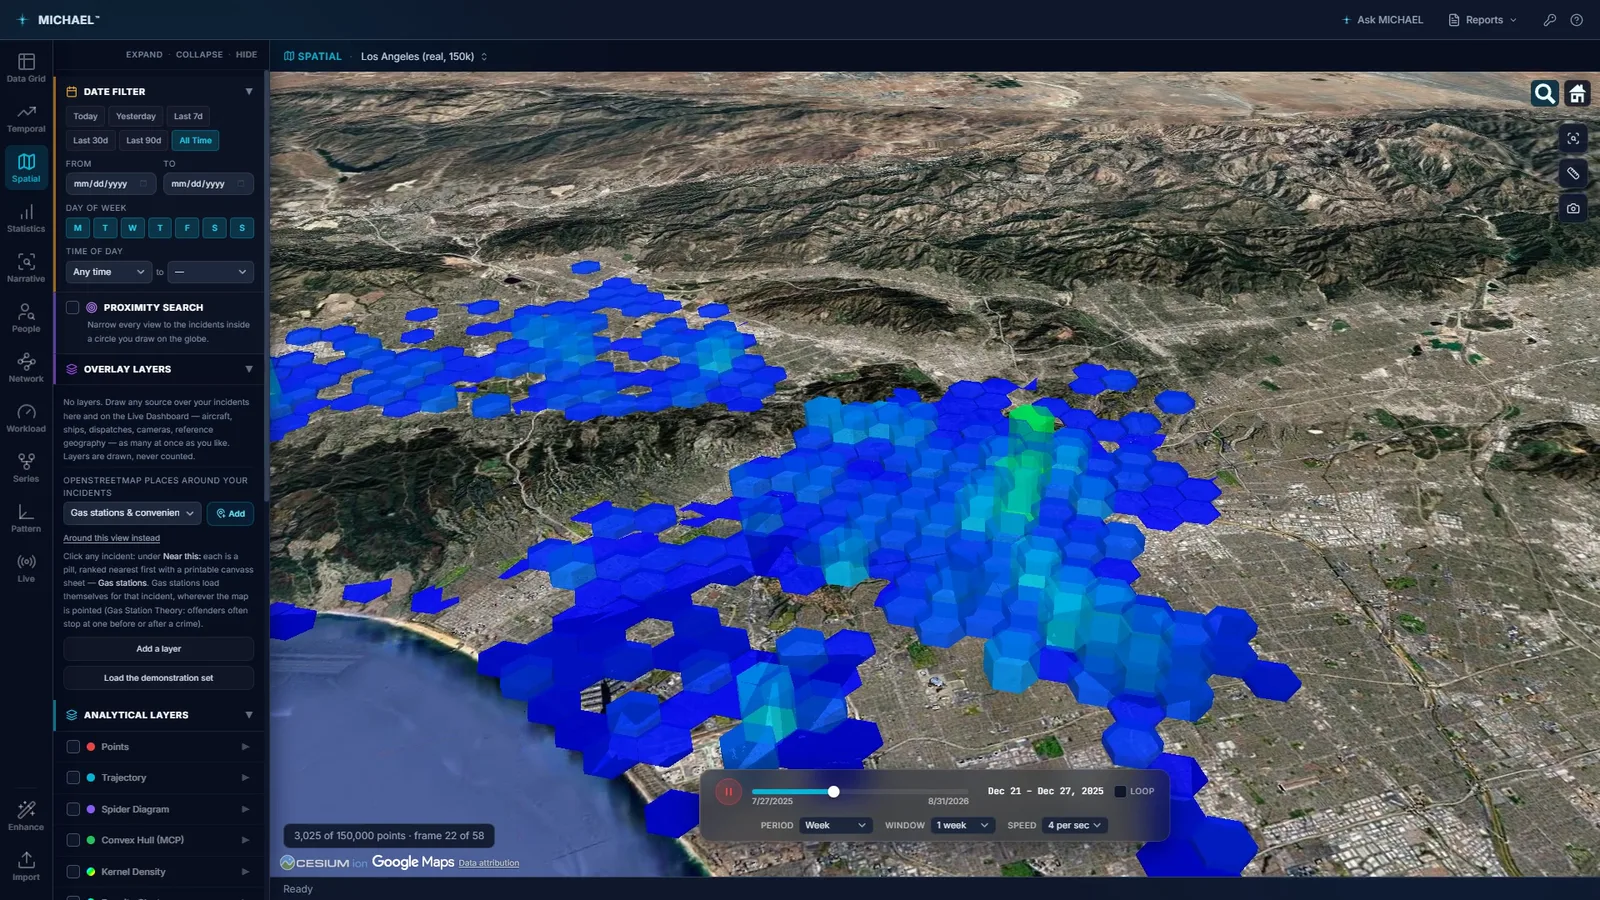
The aggregate layers rebuild as the time scrubber advances, so a hot spot that only exists in one month is visible as one. Public Los Angeles open crime data.
A surface is still useful. It just needs its radius chosen for a reason.
Density has a real job: showing the shape of where activity sits, and giving you an area to work rather than a set of cells. The questions are how wide the kernel is and what you do with the surface once you have it.
- 01The search radius is calculated from mean nearest neighbor distance, so it comes from the spacing of your own incidents rather than from a default somebody liked the look of.
- 02A quartic kernel, and a weight column when you want one. Weight by loss value, by severity, or by any numeric column, so a hundred petty thefts and a hundred armed robberies do not have to draw the same surface.
- 03Outline the densest part, then count what is inside it. Outline the top 5% turns the surface into an actual boundary and counts the incidents in each hot spot. A number you can put in a sentence beats a gradient you have to describe.
- 04Hexbin for counting, density for shape. Hexagonal cells sum the map into equal units, each extruded to the count inside it, and they keep working at sizes where drawing every point stops being readable. Use the cells when you need numbers and the surface when you need an area.
A hot spot is a statement about reports, not about a neighborhood.
Every one of these methods reads what your agency wrote down. That is worth saying out loud before anybody uses one of these maps to move people.
- 01Reporting drives the map. An area your agency patrols heavily generates more records, and more records make a hot spot. The statistic cannot separate more crime from more attention, and it does not claim to.
- 02Significant does not mean large. A statistically significant cluster can be small enough that nothing about your deployment should change. The test answers whether the pattern is real, not whether it is worth acting on. That second question is yours.
- 03No score becomes a person or a place. MICHAEL draws cells and surfaces from records and stops there. It produces no risk rating for an address, no threat score, and no list.
Try it on your own data.
Fourteen days, every feature, on one machine. Tell us who you are and we will email you your own download link. Nothing to activate. Your data stays on your machine and stays yours when the trial ends. No newsletter, no drip sequence.
Built for the people who do the work Sworn agencies, crime analysis units, public safety partners, and corporate investigation teams. Workstations are $2,500 a year, everything included. Academia and nonprofits: ask about license pricing.
Or email info@sworn.ai. A person answers.