 MICHAEL
 · CompStat dashboard
Build the dashboard once. The TV keeps itself current.
Most agencies rebuild the same numbers every Monday morning, by hand, in a slide deck. Then somebody asks a question the deck does not answer and the room waits. MICHAEL builds the page once from tiles, writes it to a folder your agency already shares, and the browser on the CompStat room's TV picks up each new publish by itself. Nothing to install on that machine, no login, no port to open, and no server standing between the two.
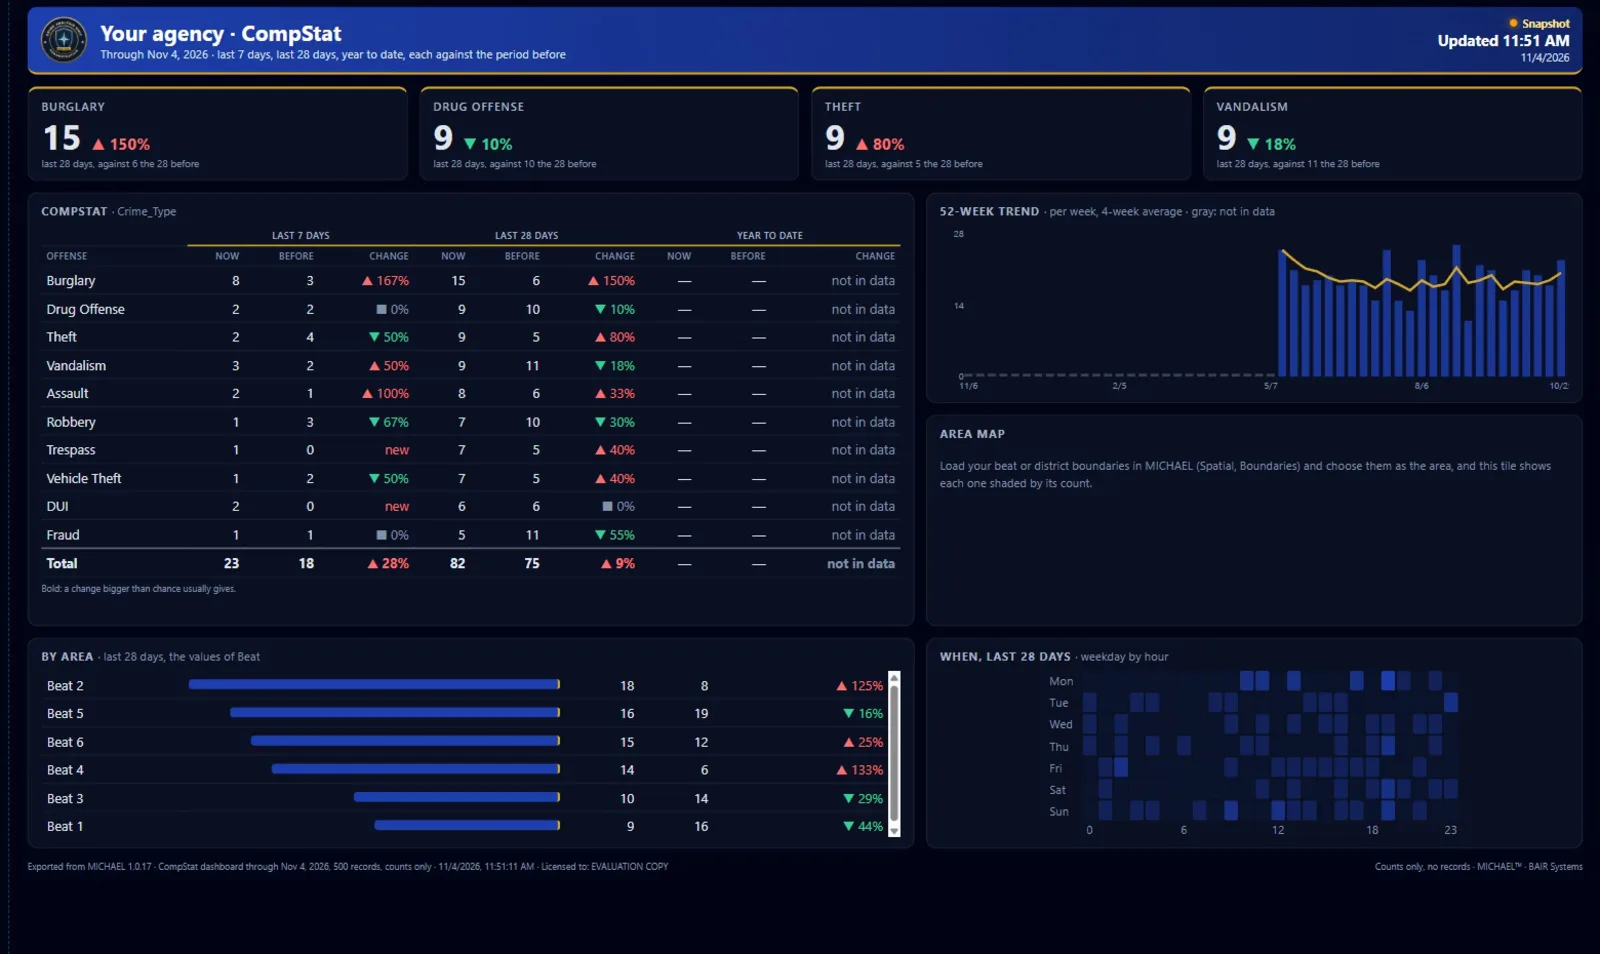
Tiles, then a folder, then it runs itself.
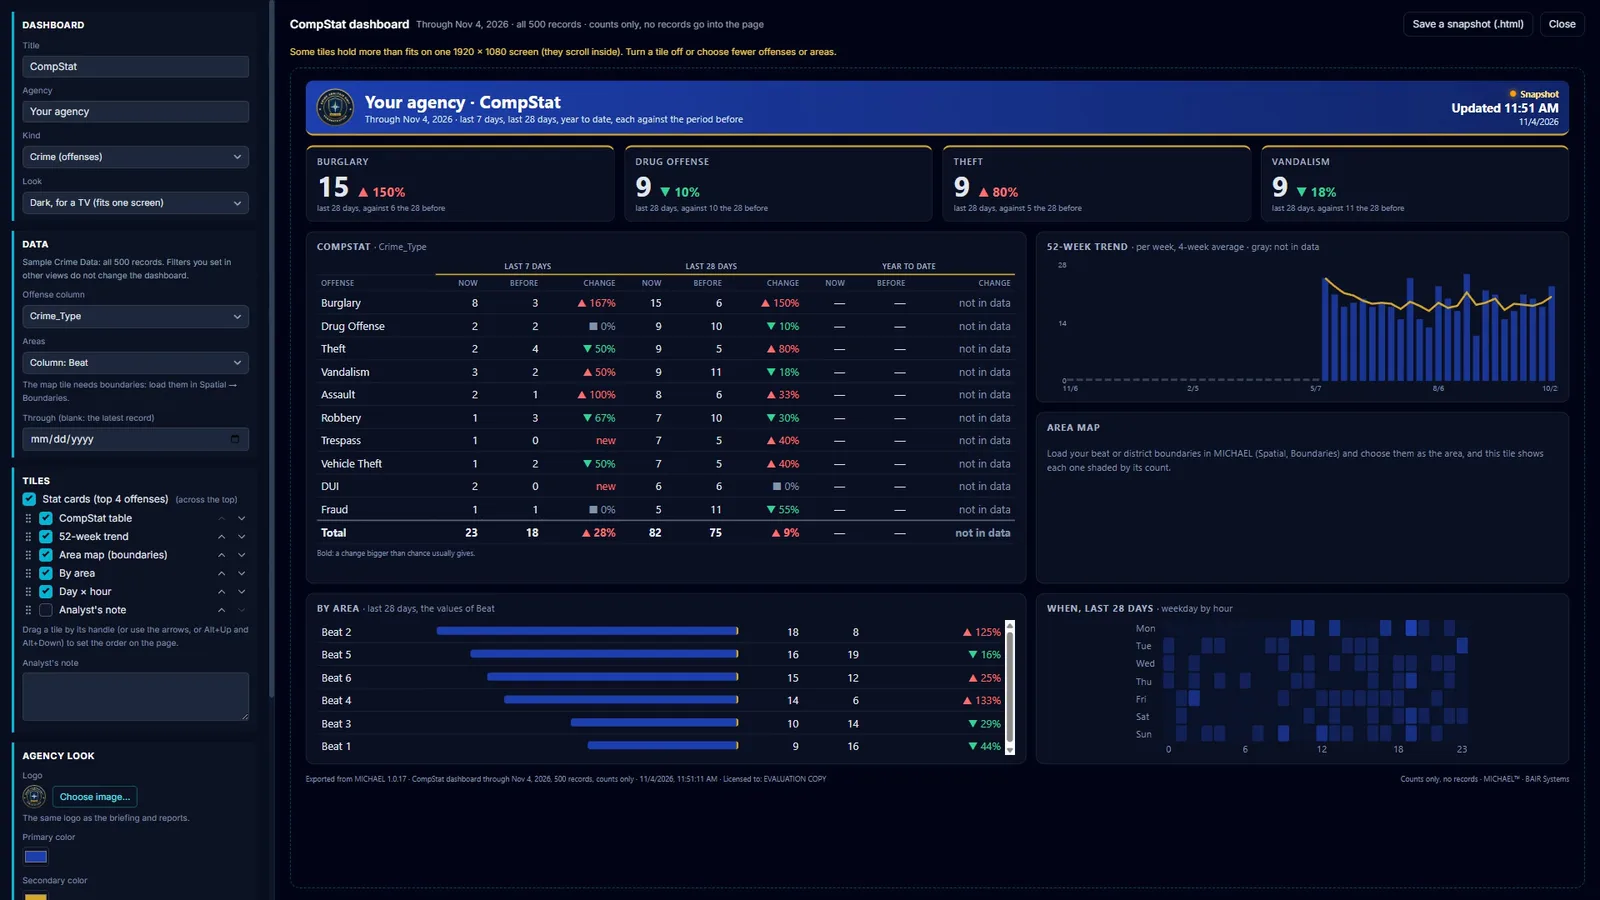
You choose the tiles, their order and the look. Each one is the same figure MICHAEL computes everywhere else, so the wall and the report never disagree.
- 01Stat cards for your top offenses, each over the last 28 days against the 28 before.
- 02The CompStat table. Last 7 days, last 28 and the year to date, by offense, each against the period before. A change bigger than ordinary variation gives is set in bold, and a period the data does not cover reads not in data, never zero.
- 03A 52-week trend, counts by area with the change, and a weekday by hour grid. Your own beat or district boundaries shaded by count, with the Gi* hot spots drawn on top once boundaries are loaded in Spatial.
- 04An analyst's note, because a number without a sentence beside it gets argued with.
- 05Your agency's name, logo and two colors. A dark look for a TV, which tells you when the tiles no longer fit on one screen, or a light one for desks, email and print. Drag the tiles into the order you want and the published page follows.
A folder your agency already shares.
Publish writes two files into a folder you choose in MICHAEL's own folder window, usually a shared drive. Open the page there in any browser, on the TV or at any desk, and it picks up each new publish by itself.
- 01Publish automatically. MICHAEL republishes every few minutes and reads the latest from where the data actually sits first: a CSV re-read from where it is, a workbook or Access database re-read from the same sheet or table, or a connected link, API or database. Nothing has to be saved as CSV to keep the wall current.
- 02The room sees the whole dataset, always. Filters you set while working do not change what is on the wall, and building a dashboard does not touch your open dataset, so your filters and selection are exactly where you left them.
- 03It says when it is stale. If the page cannot reach the folder it keeps the last numbers it had and says so on its face. A dashboard that silently shows Tuesday's figures on Friday is worse than one that admits it lost contact.
- 04Save a snapshot. One file with today's numbers, for the email that has to go out anyway.
A calls for service dashboard, chosen for you when the extract looks like CAD.
The same page, built from a CAD extract instead of a crime file, with the figures a patrol commander asks for and the arithmetic a workload study insists on.
- 01Two kinds of work, each counted on its own. Citizen calls and officer-initiated work over the last 28 days against the 28 before, reported apart.
- 02Response, hold, travel and time on scene, as the median by priority with the 90th percentile beside it. Received to the first unit on scene is the response.
- 03One response time per call. A three-unit call is one response time, not three. A duration that cannot be right, negative or over 24 hours, is left out and counted, so the median is not quietly dragged by a bad row.
- 04Calls per week, time on scene for the busiest call types, and when citizen calls actually arrive. The last of those is the weekday by hour grid the workload page takes to a staffing number.
The sheet for the meeting, from the same numbers as the wall.
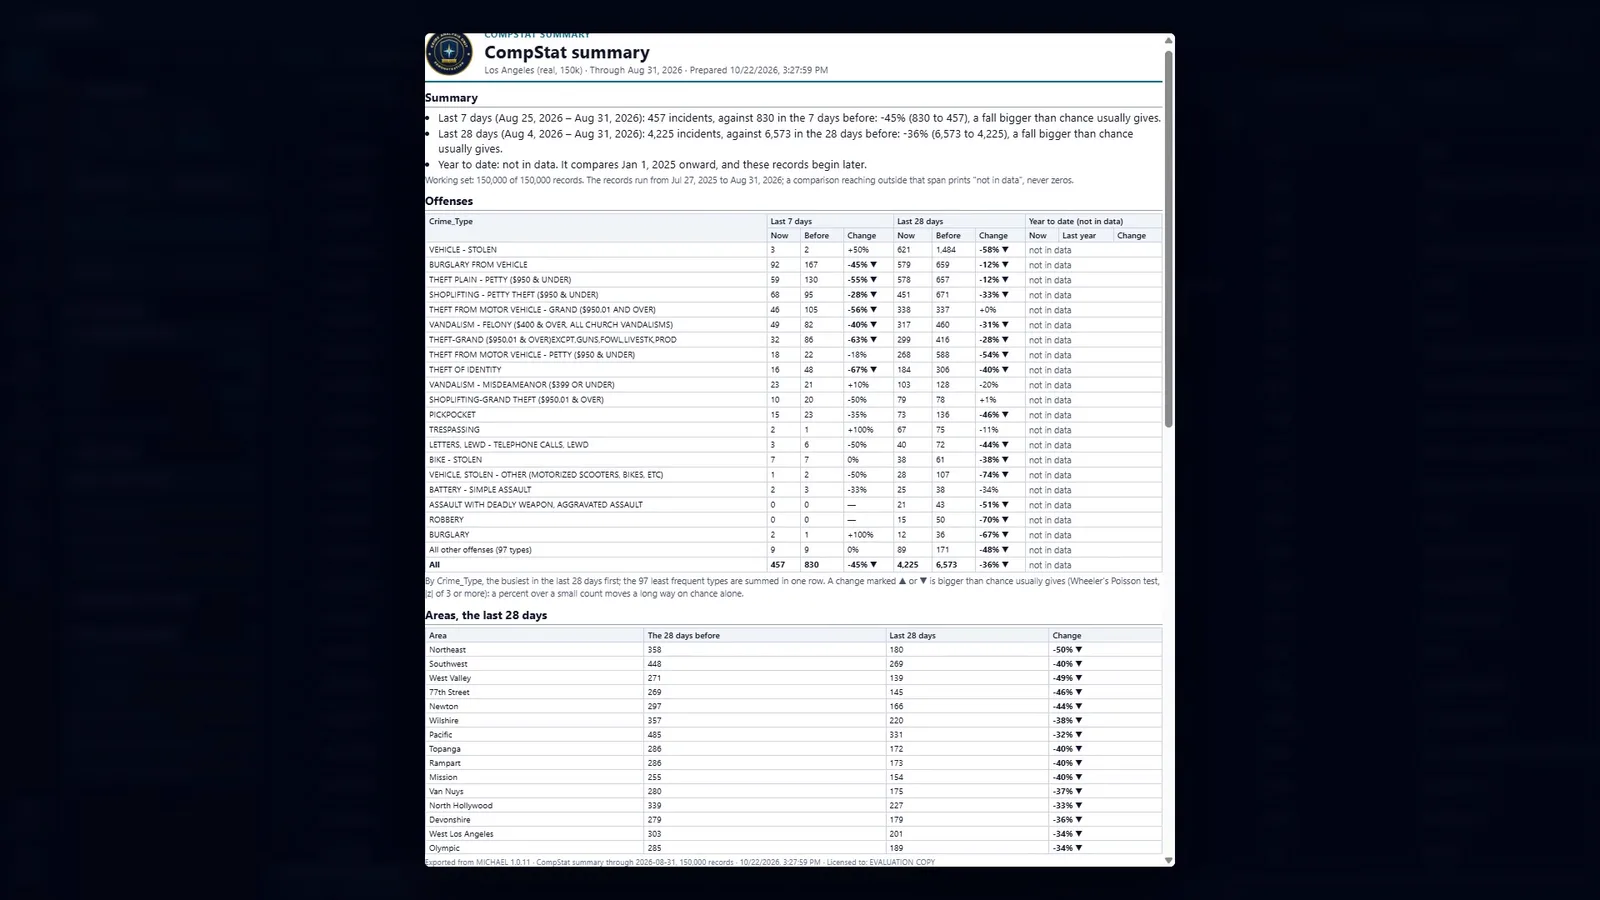
The CompStat summary is the report under the name analysts use for it: the whole jurisdiction through the latest record, the last 7 days, the last 28 and the year to date, by offense and by area, with the significant hot spots.
- 01Save it as a template. "Weekly CompStat" appears in the Reports menu, and one click rebuilds it on whatever the data says this week.
- 02Your agency's marking, and only yours. The handling banner is blank unless you set one; MICHAEL never adds a marking of its own. Your agency's logo sits at the top and the export stamp along the bottom, on every page.
- 03Everything it needs is already in MICHAEL. It is laid out from what is already loaded, the way every report in MICHAEL is. The reports page covers the six of them.
It keeps the room current, and your records stay with you.
A page that half the building can open has to be a page that cannot leak, and a page that updates itself has to be one that admits when it cannot.
- 01Counts and charts only. Two files of counts and charts. There is no setting that adds incident rows, and the area map holds your boundary shapes, not your incidents.
- 02It stays on your drive. Publishing is writing a file into a folder you chose on a drive you control. Who sees it is who can open the folder, which is your agency's call and your agency's audit.
- 03It is honest about how fresh it is. The page states when it was last published, and says on its face when it has lost the folder. A number it cannot compute reads not in data.
- 04The wall shows everyone the same picture. By design: the room sees the whole dataset, and what you are looking at on your own screen stays yours.
Try it on your own data.
Fourteen days, every feature, on one machine. Tell us who you are and we will email you your own download link. Nothing to activate. Your data stays on your machine and stays yours when the trial ends. No newsletter, no drip sequence.
Built for the people who do the work Sworn agencies, crime analysis units, public safety partners, and corporate investigation teams. Workstations are $2,500 a year, everything included. Academia and nonprofits: ask about license pricing.
Or email info@sworn.ai. A person answers.