 MICHAEL
 · Live Dashboard
The last hour, against a normal hour.
Point MICHAEL at your agency's feed and the Live Dashboard shows what has landed in the last hour beside what an ordinary hour brings: the count, the types, where on the map, and the weekday-by-hour grid that says whether tonight is unusual. Nobody drives it. It gets watched, on the wall of a real-time crime center or on the second monitor of the analyst on shift.
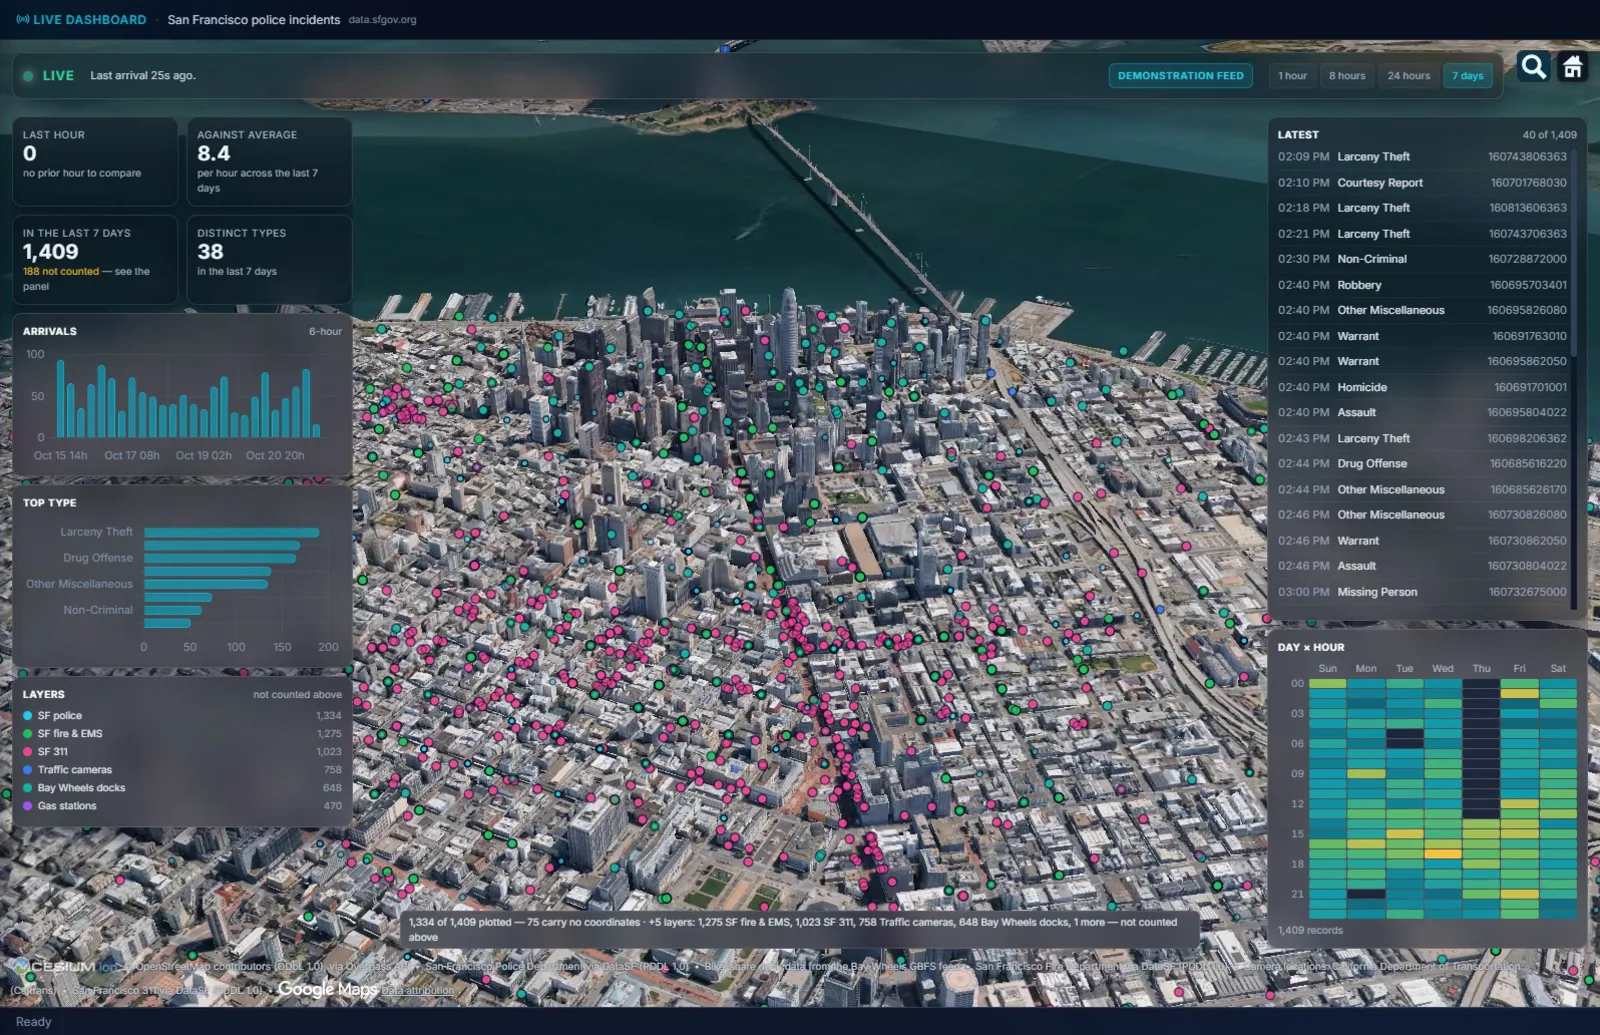
What is happening now, next to what normal looks like.
A count on its own means nothing at 2 AM. Eighty in the last hour is a quiet Tuesday or the worst hour of the year, and the only way to know is the hour beside it.
- 01The last hour, and the average hour. The two tiles that get read out loud: how many landed in the last hour, and how many a typical hour brought over the last seven days. The difference is the briefing.
- 02Arrivals as they land. A chart that fills from the right as records come in, so a surge shows as a shape before anyone has counted it.
- 03Top types, and the whole map. Which incident types lead the window, and every incident placed on the 3D city with the overlay layers your agency already uses: beats, districts, hot spots.
- 04The weekday-by-hour grid. Which hour on which day is carrying the load, built from the window you choose: one hour, eight, twenty-four or seven days.
- 05The latest list. The most recent records in order, read like a blotter, with the time since each one arrived.
You always know the feed is alive.
On a wall where decisions get made, the one thing you need to trust is that the numbers are current. So the feed's condition sits next to the numbers at all times.
- 01Quiet, live or failing, on the tile. Quiet means the poll came back empty, which is most Tuesdays. Failing says how many polls in a row have failed and why. Neither hides in a log.
- 02When the feed stops, the tiles dim and a strip says the figures are not current. A red banner alone was not enough: the tiles under it still read LAST HOUR 80, exactly as they look when everything is fine.
- 03Counted on the record's own clock. The window is measured on when the incident happened, not when it arrived, so a feed that catches up after an outage does not park yesterday in tonight's count.
- 04A demonstration feed says so on its face, in every state, because a demo must never be mistaken for the real thing on a screen somebody is making decisions from.
Stay connected to the source.
The question heard most at the first demonstration. A dataset can stay connected to where it came from, and one click of Refresh replaces the records in place.
- 01A link, an API, or a database. A web address for a CSV or GeoJSON file, a web service that needs a key, or a table in Microsoft SQL Server, MySQL, PostgreSQL or any ODBC source your IT department has set up.
- 02Describe millions of records where they sit. A records table can be far larger than anyone should pull onto a desktop. MICHAEL asks the database to count by type, by month, by weekday and hour, or across two columns, and only the counts come back.
- 03Pull the ones you mean. Click any bar, row or cell of a summary and bring in exactly that group as a connected dataset you can refresh tomorrow.
- 04Refresh keeps what you had. If a refresh fails or comes back empty, your existing records stay and the panel says why. Your own corrections are put back after a refresh, matched by case number.
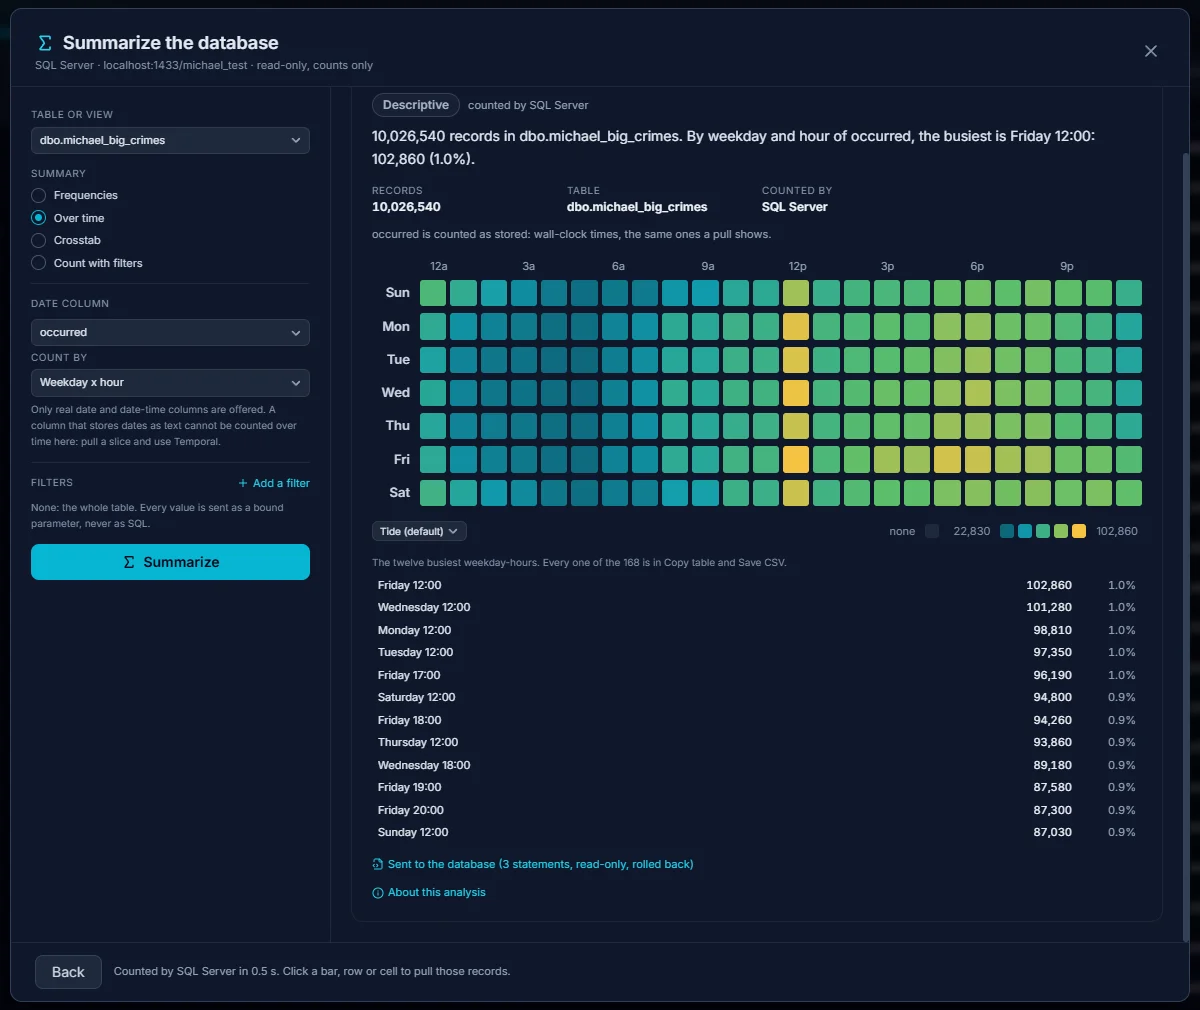
It shows what has arrived, as it arrives.
The Live Dashboard is a window on the present. Three commitments, on purpose.
- 01It reports the present. The dashboard compares the last hour with a normal one; the six forecasting methods live in temporal analysis, where they are checked against your own data first.
- 02Every number on the wall is complete. A poll that comes back short, or too large, is refused with a sentence that says so, and the numbers you had stay as they were. A dashboard that quietly dropped half a poll would report a calm night during the worst hour of the year.
- 03It reads the source and leaves it as it was. Nothing connects inbound, nothing is written back, and nothing is sent anywhere but the feed you pointed it at.
Try it on your own data.
Fourteen days, every feature, on one machine. Tell us who you are and we will email you your own download link. Nothing to activate. Your data stays on your machine and stays yours when the trial ends. No newsletter, no drip sequence.
Built for the people who do the work Sworn agencies, crime analysis units, public safety partners, and corporate investigation teams. Workstations are $2,500 a year, everything included. Academia and nonprofits: ask about license pricing.
Or email info@sworn.ai. A person answers.