 MICHAEL
 · Statistics
A clean negative is still an answer.
Twenty-three statistical modes, computed on the analyst's own machine with every p-value worked out in the app. The one that matters most to a working unit is the near repeat test: after an incident, is risk nearby genuinely raised for a while, or does that area just stay busy? MICHAEL answers with a Knox table against 999 permutations, prints what the result does not say, and when there is nothing there it says so in those words.
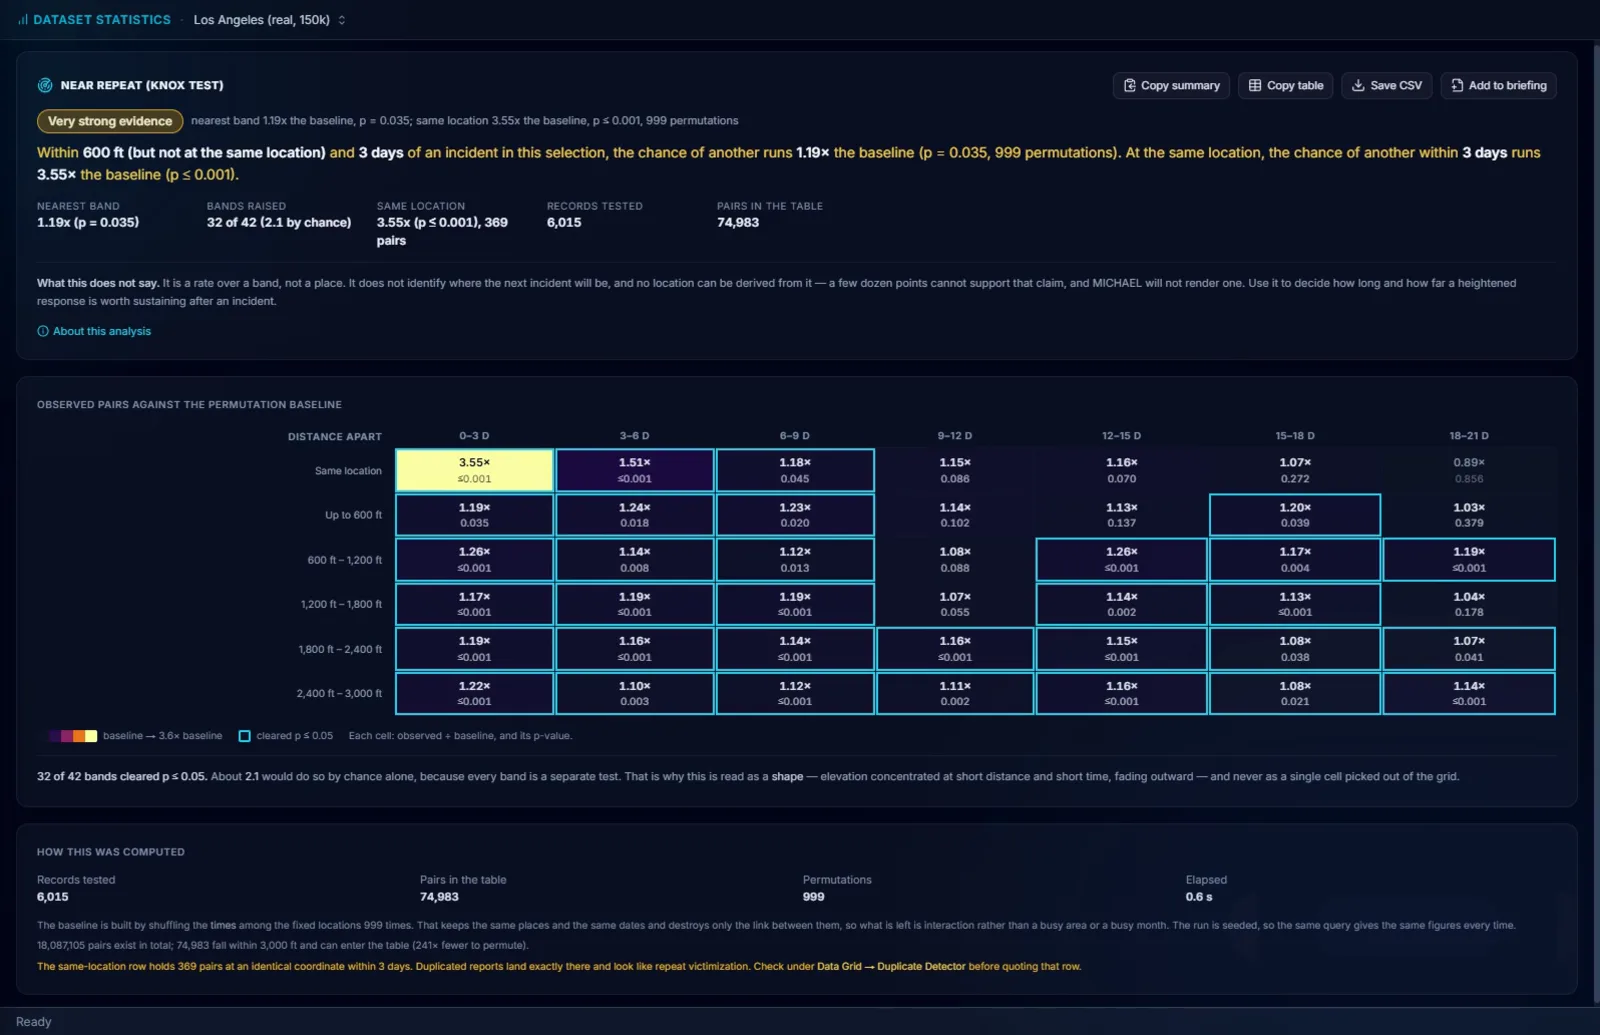
Twenty-three modes, computed right here.
Every p-value is computed in the app. No external statistics library, no server call, and no export to SPSS, SAS, Tableau or ArcGIS to get a number you can defend.
- 05Descriptive. Data summary, frequency table, percentiles and box plots, distribution shape, and outlier detection, which flags the $40,000 burglary sitting in a series of $400 ones. Usually a data entry error. Sometimes the break in the case.
- 07Relationships and tests. Chi-square and crosstab, which tests whether entry method really varies by premises type or only looks like it does. Goodness of fit, correlation matrix, regression with an R² that tells you whether to believe it, ANOVA across three or more beats at once instead of running t-tests until something turns up, Benford's Law for figures entered by the people who benefit from them, and near repeat.
- 08Financial and trend. Pareto (80/20), cost curve, experience curve, high-low-close, CUSUM, which finds the point where the mean shifted and is almost always earlier than anyone noticed, break-even against a budget line, waterfall, which answers "crime is up 8 percent, driven by what" in one chart, and comparative period, a median split of the records with how it divides them stated.
- 03Places and areas, and evaluation. Percent change by area, 80/20 for places, and Weighted Displacement Difference, each with its own section below.
- →Every result leaves the same way. Copy summary gives a plain sentence you can read out, Copy table and Save CSV give the figures, and Add to briefing puts it in the document. Click any row in an outlier list and the record opens.
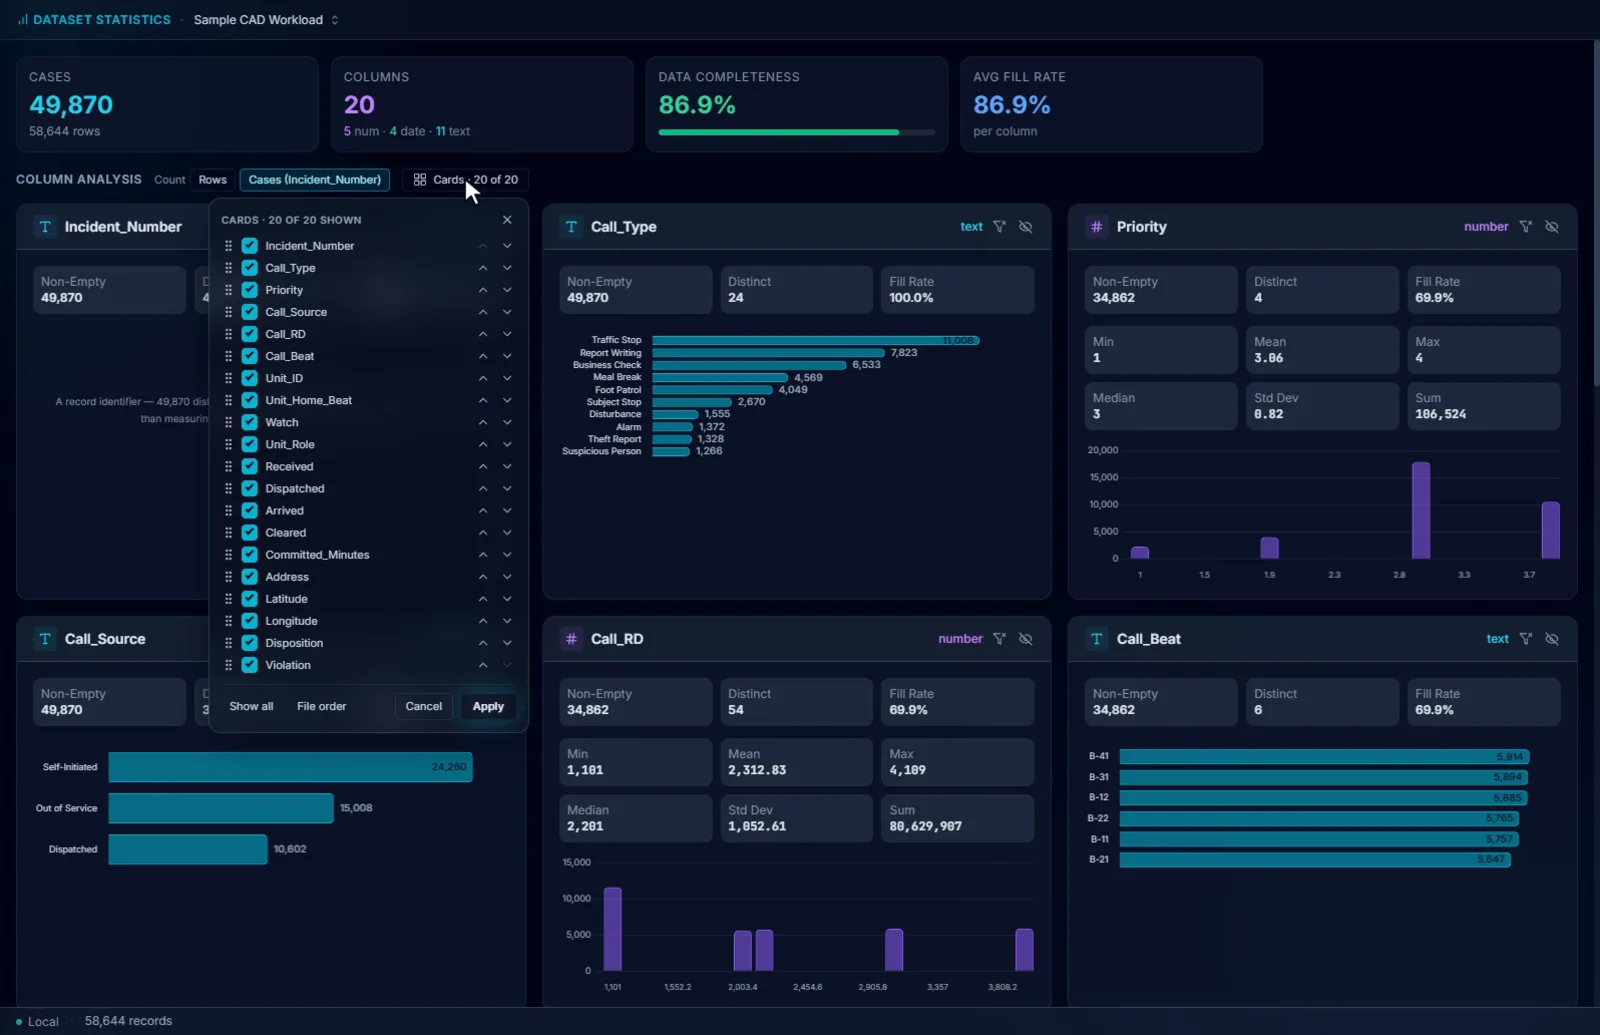
Which fields are actually populated, before you build on one that is 60 percent empty.
The Data Summary is the first thing to open on a new export: one card per column with its fill rate, its distinct values and its distribution, and a completeness figure for the whole file.
- 01Rows or cases. A table with a row per offense overstates its incidents. The Rows / Cases switch counts each case number once, and every card counts the cases holding each value.
- 02Set aside placeholder addresses. An office address typed when the place is unknown can be left out of that card, or out of every view, and the choice is kept.
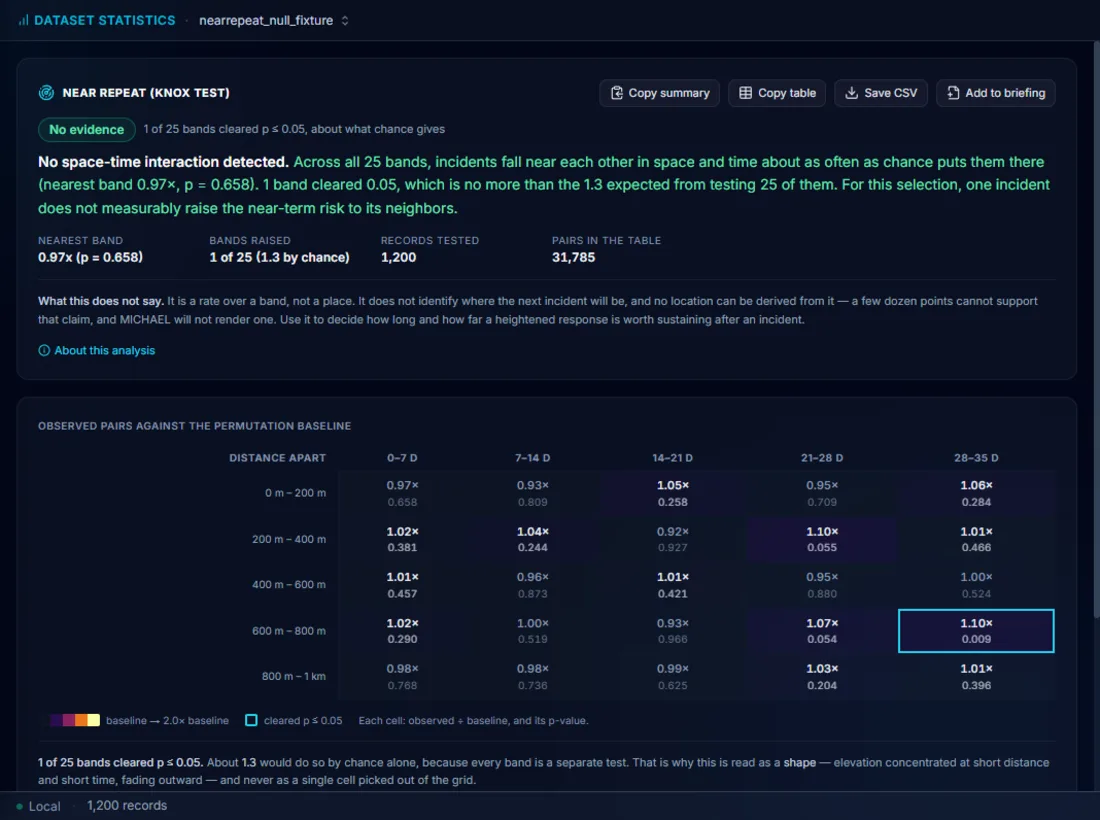
Is nearby risk genuinely raised, or does that area just stay busy?
A Knox space-by-time table against 999 Monte Carlo permutations answers exactly that, and the answer is how long and how far a heightened response is worth sustaining after an incident.
- 01Distances in feet, bands in days, both yours to set. The defaults reach 3,000 feet and 21 days, so a first run covers three weeks in steps you can act on. Burglary, vehicle crime and robbery do not share distances, which is why the bands are not fixed.
- 02The baseline is built from your own data. The times are shuffled among the fixed locations 999 times, which keeps the same places and the same dates and destroys only the link between them. What survives is interaction, not a busy area or a busy month.
- 03A separate same-location row. Repeat victimization at one address is read apart from a near repeat nearby. The panel also warns that duplicated reports land exactly there and look like repeat victimization, and names the Duplicate Detector to check first.
- 04Read as a shape across the bands. Every band is a separate test, so the verdict counts how many cleared against how many would by chance, and asks whether the elevation sits at short distance and short time and fades outward. A single cell picked out of the grid is not a finding.
- 05It reports raised risk in space and time. A predicted address needs far more than a few dozen points, so MICHAEL reports where and when risk is raised. The panel says this above the table, in those words.
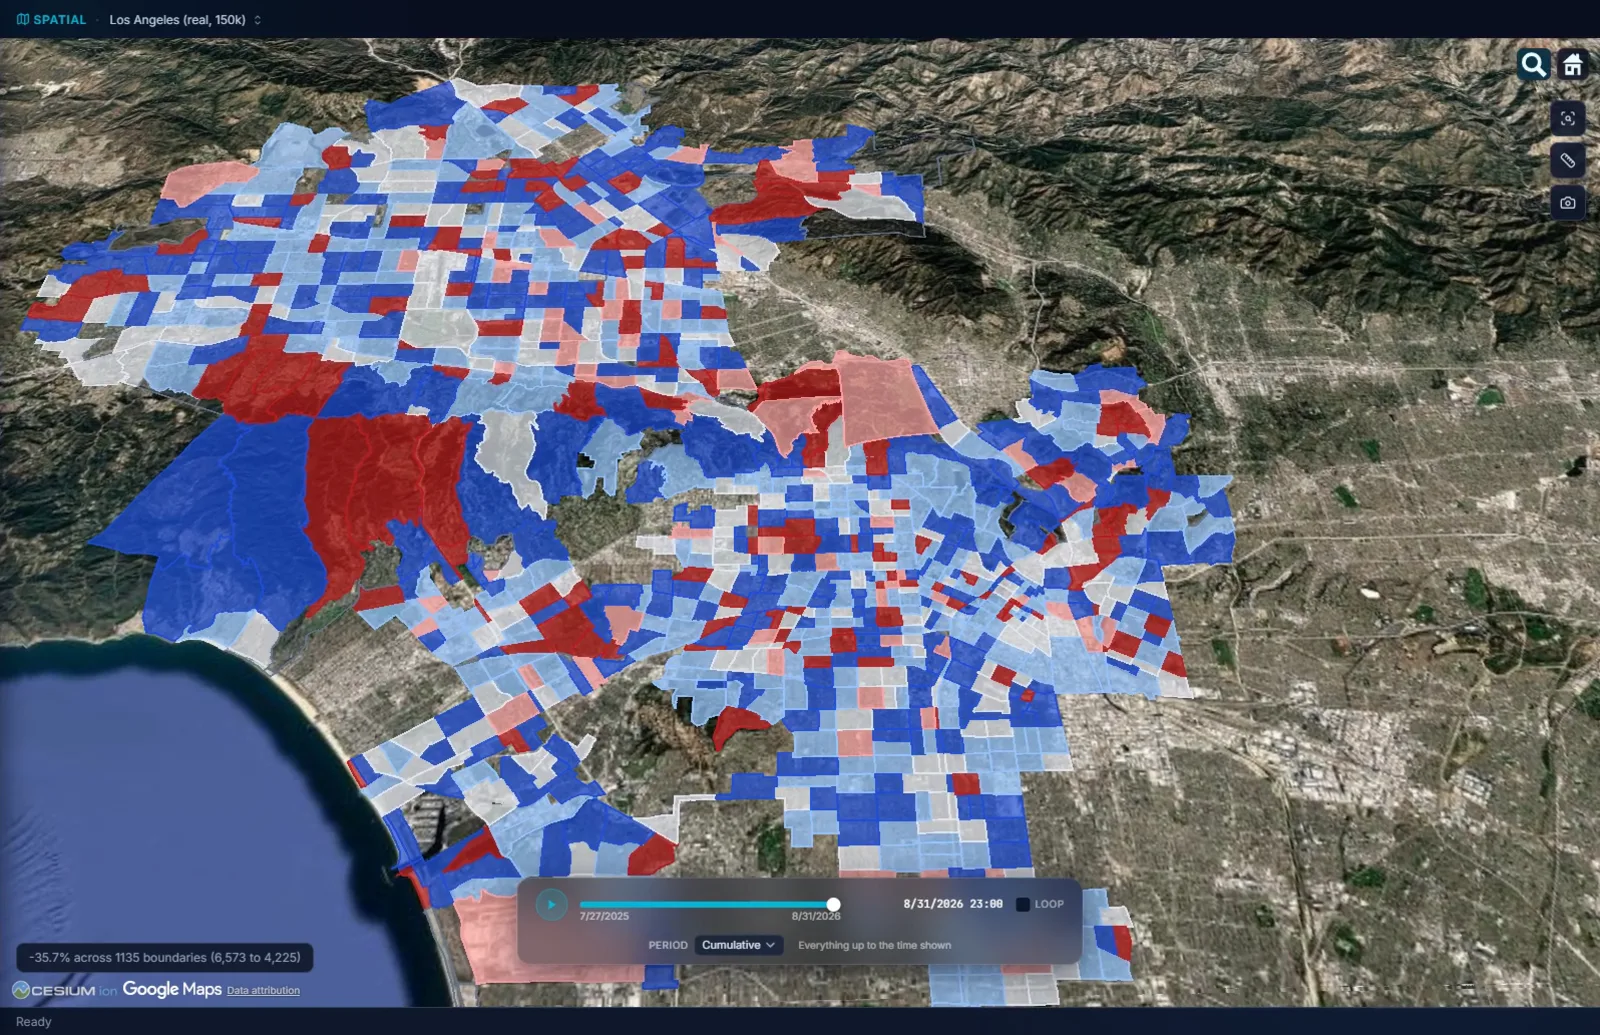
Which areas rose, which addresses carry the load, and where a camera earns its place.
Four modes that answer the questions a command staff meeting actually asks, each with the arithmetic a council member can check.
- %Percent change by area. Two equal periods per area, each area's counts, the change, and a significance measure so a swing from 3 to 6 is not mistaken for a trend. Red for an increase, blue for a decrease, on your own boundaries. An area that went from zero is labeled new, never given a percentage, and a period that falls outside your data is refused rather than counted as zeros.
- 8080/20 for places. Ranks locations by incident count, by repeat address, by a column, or by your own boundaries, shows the cumulative share, marks the top 20 percent, and narrows every view to those locations in one click. The hot spot argument in a form a city council understands.
- CAMCamera, LPR and drone placement. Candidate sites from the top 20 percent of locations or any place layer you have loaded, ranked by the incidents within reach, feet for cameras and miles for drones. Then a short list where each site adds the most incidents the earlier ones did not cover, with the running percent covered.
- WDDWeighted Displacement Difference. Wheeler and Ratcliffe's test of whether a response area improved more than its control, with displacement and diffusion of benefit into the surrounding rings. The suitability checks run first and name any test the control area fails, before a result is shown.
Six forecasting methods, each checked against your own data before it is shown.
MICHAEL forecasts time windows, areas, and how much a risk is raised. It never places a single predicted pin on the map, and it never names a person as likely to offend. Help gathers all six on one page, each saying what it predicts and how it is tested.
- 01Where and when a series strikes next. The hours it favors, the area it keeps returning to, and the date window of the next event, each scored on replays of the series' own history. The series page shows the replay.
- 02When the next event of a run is due. Four models of the gaps between events, mean interval, lag variogram, tempo regression and cyclic adjustment, scored against each other on your data, with the best one named and a window around each predicted date. The lag variogram rates its own rhythm from Predicts Perfectly through Fails to Predict.
- 03How long risk stays raised after an incident. The near repeat test above: a risk elevation by distance and time band, never a location.
- 04Where activity is concentrating. Areas significantly hotter than their surroundings, corrected so chance alone does not light up the map, and areas whose counts are rising faster than chance. The hot spot page shows a test returning nothing.
- 05Where an offender is likely based. A geographic profile over a series' locations, with buffer zone modeling and a check of how much the answer moves when any one event is left out. If pulling one incident moves the anchor half a mile, you learn that before you brief it.
- 06What each hour of the week will demand. The hour-by-weekday pattern of citizen-generated workload, averaged over every week in your data. The workload page takes it to a staffing number.

It computes the p-value. What it means is still your call.
A statistic on a briefing slide gets challenged by the one person in the room who reads everything. These are the challenges MICHAEL has already answered for you, and the ones it leaves with you.
- 01Forecasts point to windows and areas. Every forecast is a window, an area, or a raised risk. The near repeat panel says a location cannot be derived from it, and the geographic profile reports how much its own anchor moves.
- 02Small counts are treated as small counts. Percent change carries a significance measure, an area from zero is labeled new rather than given infinity, and a period your data does not cover is refused rather than filled with zeros.
- 03A test can come back empty, and does. No evidence is a verdict the near repeat test gives, the hot spot test draws nothing on a random scatter, and a model that cannot forecast your series says so instead of guessing.
- 04The method is readable. Every panel has About this analysis, every table says how it was computed, and the sample variance, the correction and the permutation count are stated rather than assumed. Whether the finding belongs in the brief is a judgment the software does not make for you.
Try it on your own data.
Fourteen days, every feature, on one machine. Tell us who you are and we will email you your own download link. Nothing to activate. Your data stays on your machine and stays yours when the trial ends. No newsletter, no drip sequence.
Built for the people who do the work Sworn agencies, crime analysis units, public safety partners, and corporate investigation teams. Workstations are $2,500 a year, everything included. Academia and nonprofits: ask about license pricing.
Or email info@sworn.ai. A person answers.