 MICHAEL
 · Temporal analysis
Agency data gives you a window. MICHAEL counts it honestly.
A burglary reported Monday morning could have happened any time since Friday night, and most tools count it at the moment the report was typed. MICHAEL shows the week as 168 cells, counts a windowed incident nine honest ways, and puts every record, every call and every case event on one timeline you can zoom from months to minutes.
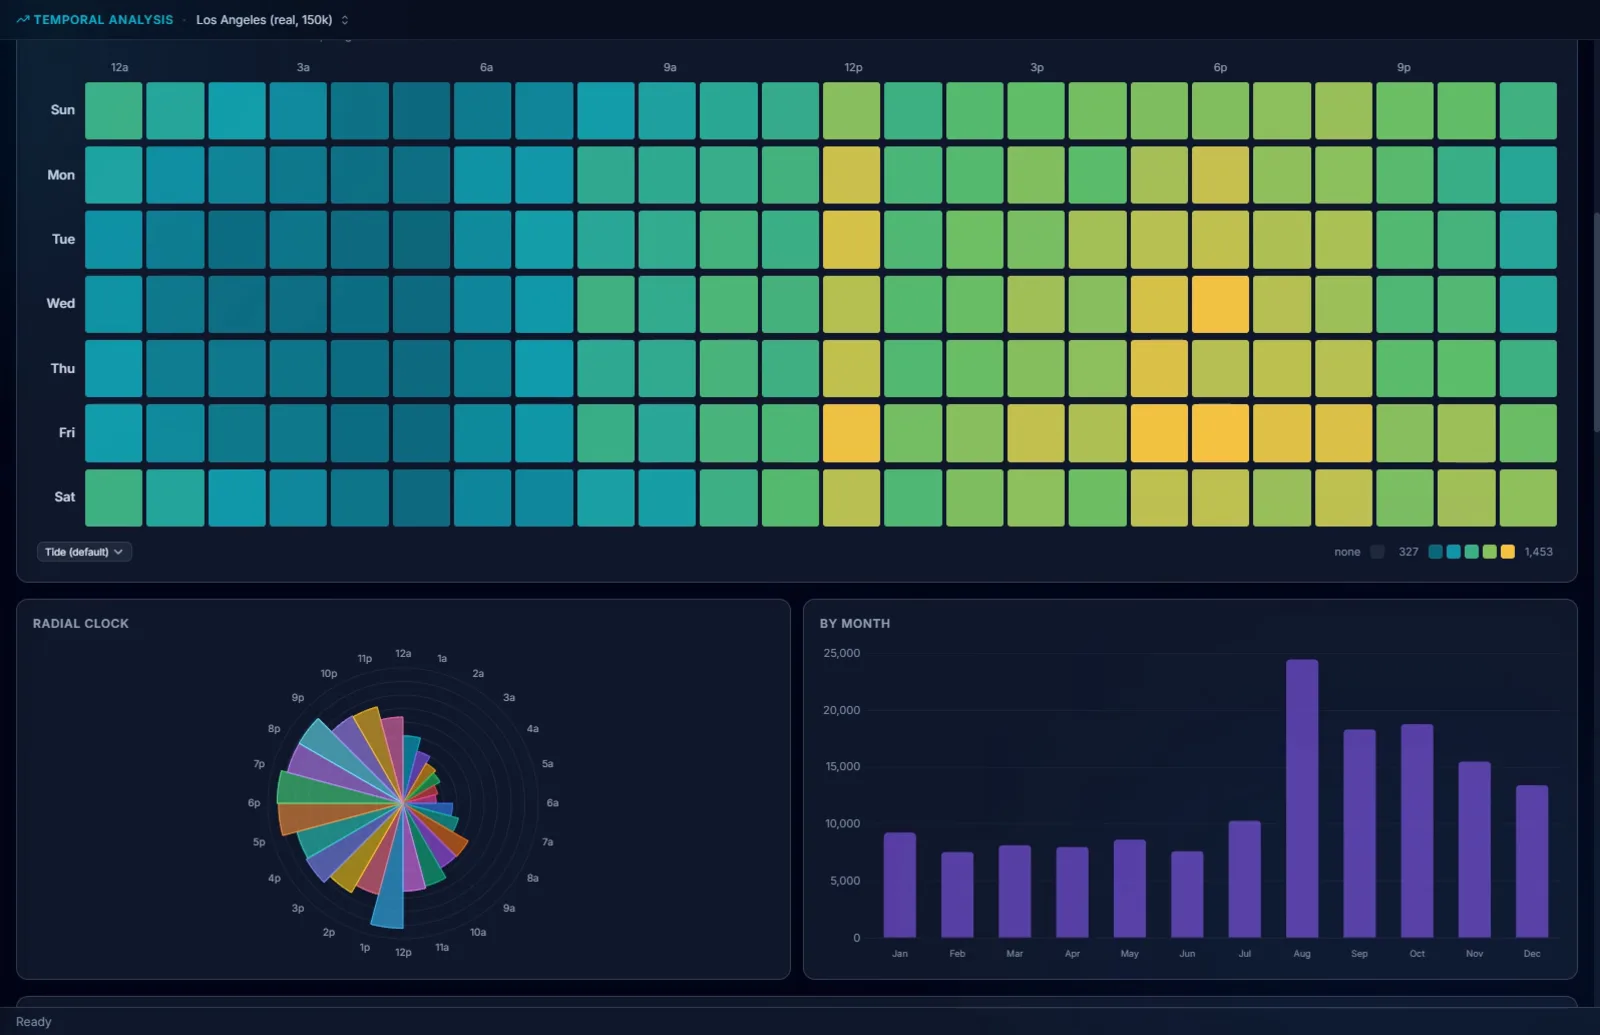
Day by hour, across the whole week.
When the series actually operates is a question about 168 cells, not about a bar chart of hours. The activity heatmap answers it, and every other panel in the view reads the same records through the same filter.
- 01168 cells. Weekday by hour, with the counts on a color ramp and the legend saying what the ends mean. Copy, Save and Add to briefing, like every chart in MICHAEL.
- 02The clock and the calendar. Hour of day around a 24-hour dial, counts by month, by weekday and by hour, and hour of day drawn as one line per weekday so a Friday that behaves like a Saturday stands out.
- 03The series over time. Count, sum or average by hour, day, week, month, quarter or year, as a line, bars or an area, on the date column MICHAEL detects or the one you choose.
- 04Records with no time are counted where they belong. The three hour-of-day panels leave such records out and say how many they left out. Day of week, month and calendar views still count them, because those are known.
Nine ways to count an incident that took eight hours.
An earliest and a latest time is what the report actually gives you. Time Span Analysis works with that window instead of pretending the report time is the crime time, and tells you which method made the chart.
- WWeighted. Splits 1/N across every hour the window touches. An eight-hour burglary contributes 0.125 to each of its eight hours.
- EEqual opportunity. Counts a full incident in every hour it touched, so the chart shows every hour the crime could have happened in.
- AAoristic. Spreads each incident across its window weighted by the minute, over the 168 weekday hours, with a heat chart and a CSV. An end date with no time reads as the end of that day, so "from 22:00, discovered that day" is spread over 22:00 to midnight.
- MMidpoint. The middle of each window, reported with the mean, the standard deviation and the 1σ and 2σ bands.
- +5Exact start time, duration distribution, overlap heatmap, Gantt timeline and temporal coverage, which finds the genuinely quiet windows rather than the apparently quiet ones.
- 06Two of the nine run on a single time. Most records systems export when a crime happened, not a window. Exact and Aoristic run on that one time; the seven that need an earliest and a latest are shown with the reason they are unavailable rather than hidden, so you know what the export is missing.
- 07Every method explains itself. A one-line description of the method you are looking at, and a comparison of all nine saying which need a window. The chart you put in a brief names its method.
Every record on one axis, from months down to minutes.
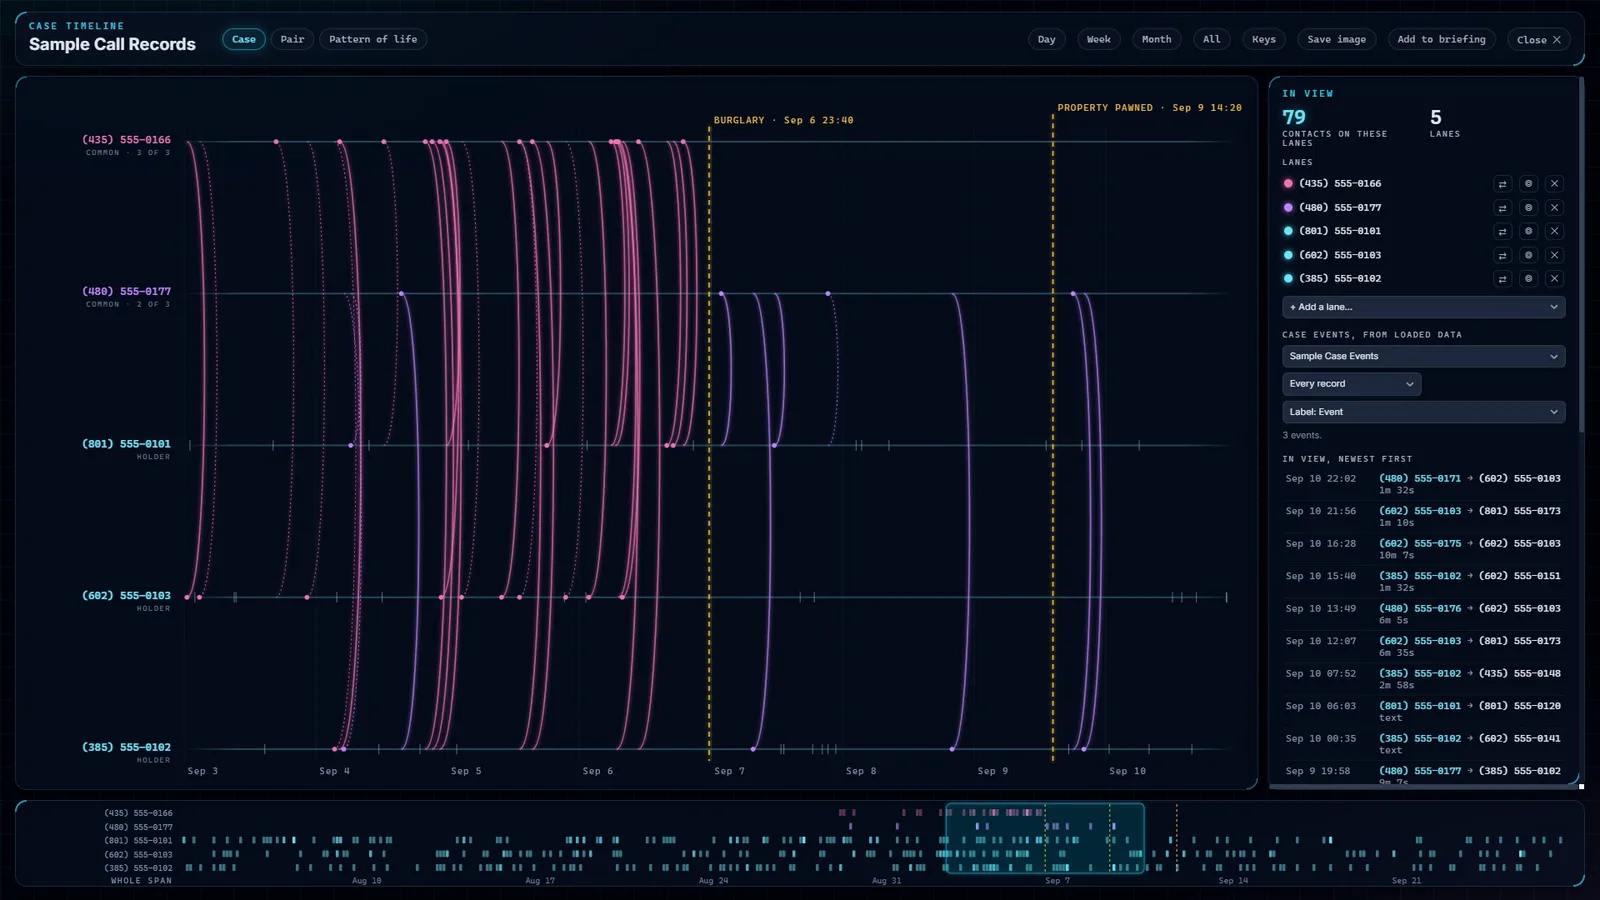
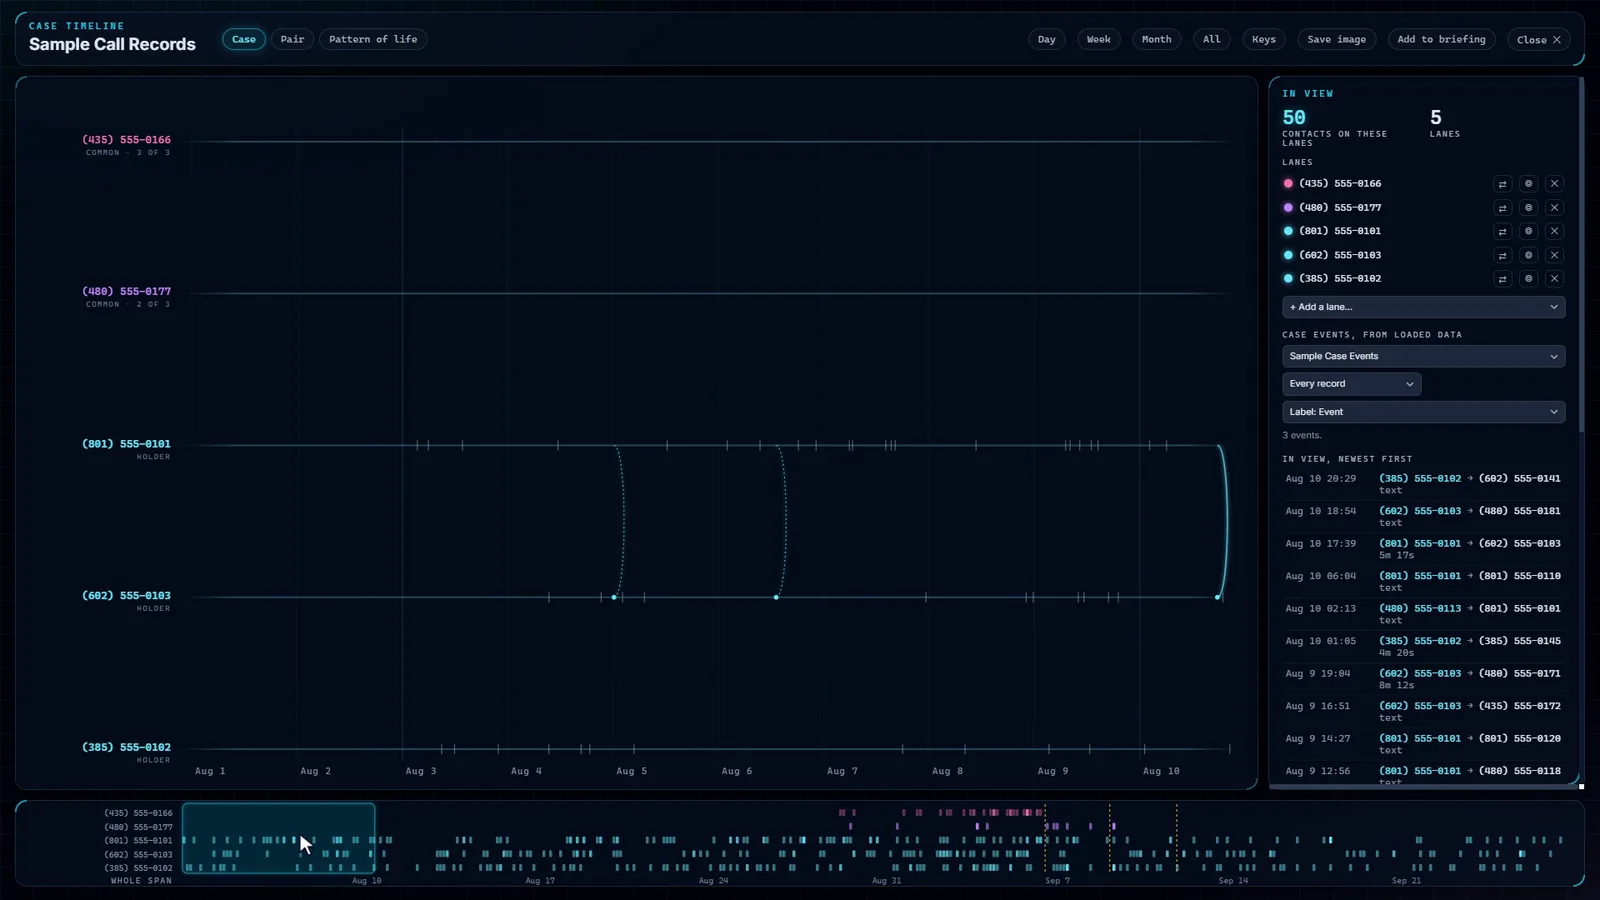
Timeline in Temporal, and Case timeline from the Network view's link table, opens a window with one lane per suspect, vehicle, beat or phone and every record placed at its moment.
- 01Months to minutes. Scroll to zoom, drag to pan, and drag on the strip along the bottom to jump anywhere in the span. The whole window works from the keyboard, and a screen reader hears each change.
- 02Call records draw themselves. The lanes start as the record holders and their common contacts. A call between two lanes is an arc, a call with anyone else a tick, and a text a dotted line.
- 03Case events come straight from your own data. Choose a loaded dataset, the case's incident reports say, and one value of one column if you like, and each record is a line at its date. A timeline cannot drift from the records behind it.
- 04Every mark is a record. Click one to select it and open it. Show these rows hands what is in view to every other view, and Save image and Add to briefing take the picture with you.
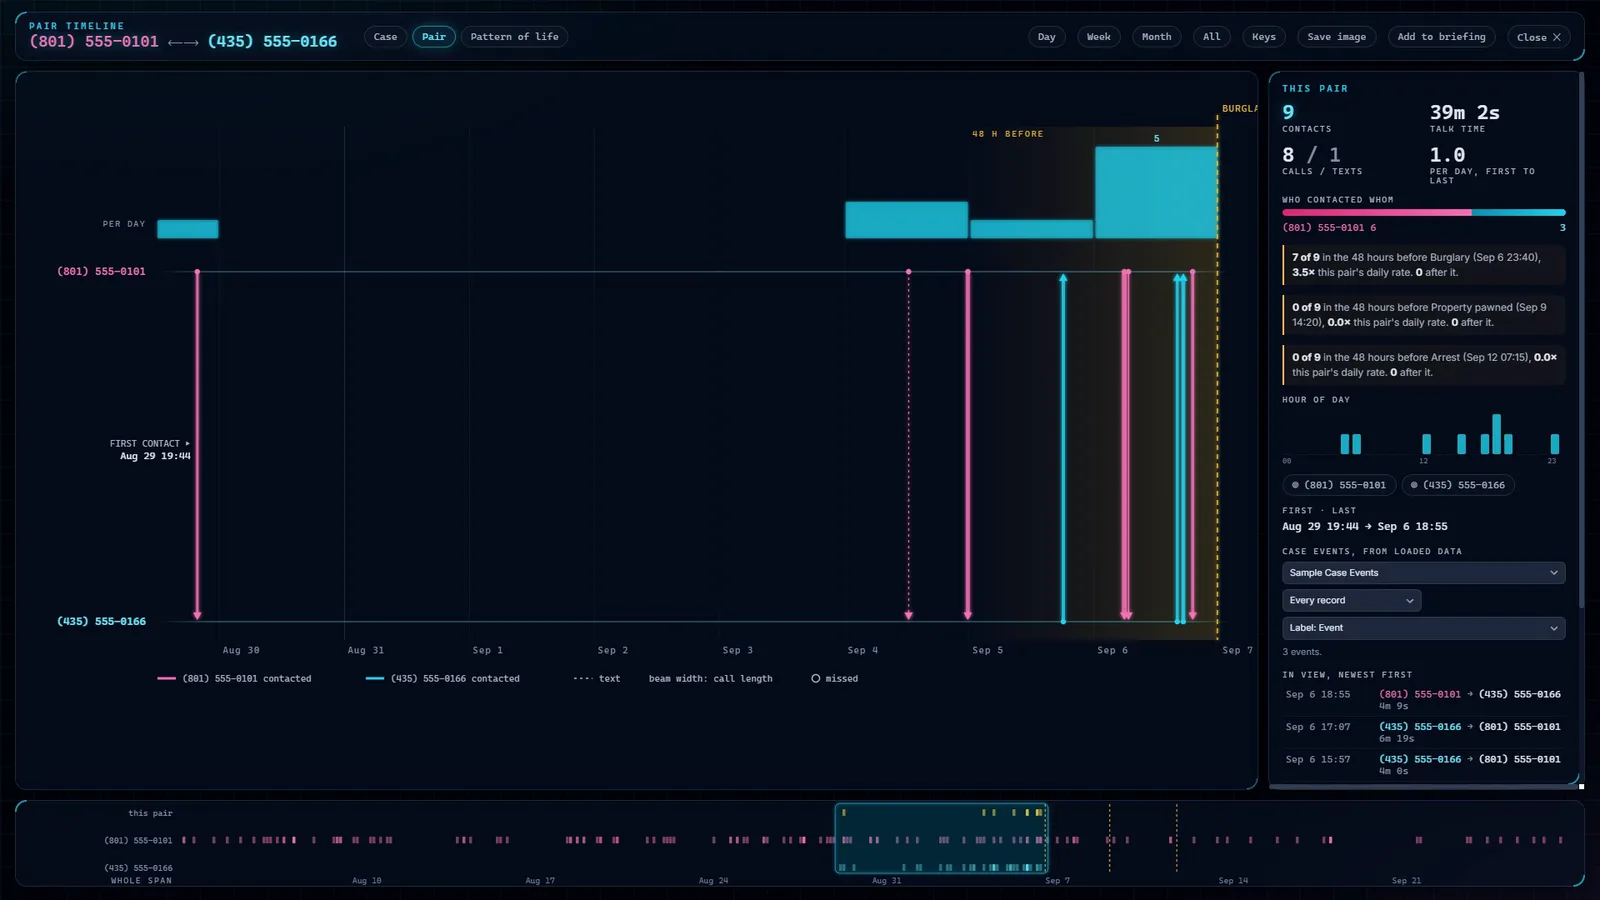
Two numbers, and the silence after the last call.
Pair shows every contact between two numbers as a beam aimed at whoever was contacted, as wide as the call was long. The silence after the last one is usually the thing worth explaining.
- 01Rate, first and last. Contacts per day above the beams, the first contact marked, who contacted whom, calls against texts, talk time, and the hour of day they talk.
- 02Each case event is scored against the pair's own rate. How many contacts fell in the 48 hours before the event and how many after, as a multiple of what this pair does on an ordinary day.
- 03Open it from anywhere a number appears. From a number's links in Network, or with the arrows beside a lane in the timeline.
One number, round the clock.
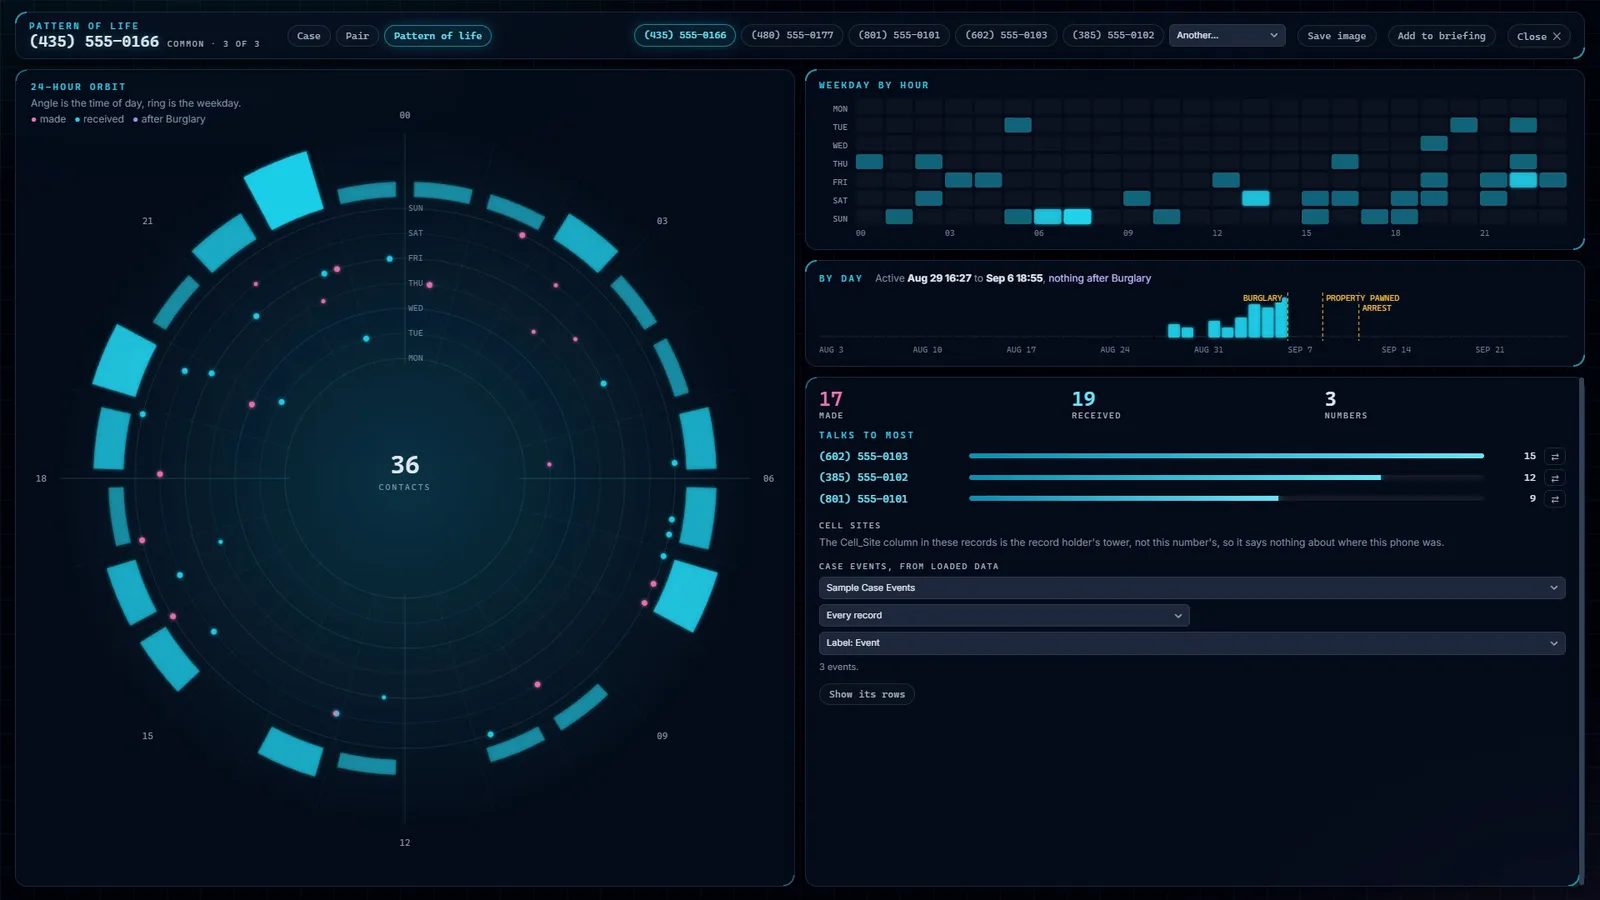
One number, or one suspect or vehicle: a 24-hour orbit where the angle is the time of day and each ring a weekday, every contact a dot in its own color for made and received, the contacts per hour around the edge, and the longest stretch of hours with nothing shaded.
- 01Beside the orbit. Weekday by hour, every day of the span with the case events marked (it says when a number went quiet after one), and who it talks to most, each opening the pair timeline.
- 02Cell sites, only when they are its own. A cell site in a call record belongs to the record holder's phone. For any other number MICHAEL says so, instead of listing towers that were never its own.
- 03A record holder's route on the globe. With a tower list loaded, its own calls in time order, each run of calls at one tower a stop, drawn as a line through the stops with a point at every tower. Calls at a site the list does not have are counted and named, never placed.
It places records in time.
Every chart on this page is a statement about records. The panels say so where it matters, and the brief you build from them should too.
- 01A tower marks where the phone connected. The route on the globe says so, the cell sites panel refuses to list towers for a number that is not the record holder, and nothing here draws a person's location.
- 02Every chart names its counting method. Seven of the nine Time Span methods exist because the report time is not the crime time. The chart names the method it used, and so should the brief, because two methods on the same records can put the peak in different hours.
- 03A date with no time stays unknown. It is left out of every hour-of-day panel and counted. A chart that put those records at midnight would show a peak that nobody committed.
- 04A gap in contact is a question for the detective. The pair timeline marks the gap after the last contact and scores the 48 hours before an event. What either means is for the detective, and the timeline does not guess for them.
Try it on your own data.
Fourteen days, every feature, on one machine. Tell us who you are and we will email you your own download link. Nothing to activate. Your data stays on your machine and stays yours when the trial ends. No newsletter, no drip sequence.
Built for the people who do the work Sworn agencies, crime analysis units, public safety partners, and corporate investigation teams. Workstations are $2,500 a year, everything included. Academia and nonprofits: ask about license pricing.
Or email info@sworn.ai. A person answers.